Insolvencies continue to track sideways at elevated levels
Key insights:
Warning signs flash despite some stabilisation – Insolvencies remain elevated but broadly stable; however, the July spike in B2B trade payment defaults signals fresh pressure on businesses and the risk of another lift in insolvencies.
Traditionally ‘safe’ industries wobble – Sectors like Financial and Insurance Services and Healthcare and Social Assistance, usually seen as low-risk, are showing a rise in insolvencies and payment defaults, highlighting how widespread the strain has become.
Discretionary sectors hardest hit – Construction, Hospitality and Retail continue to carry the highest insolvency burden, reflecting ongoing stress in industries most exposed to tightening in consumer spending.
Sectoral rotation in stress areas – Previously hardest-hit industries like Construction and Hospitality are showing early signs of stabilisation, while new pockets of weakness are emerging in Transport, Professional Services and Healthcare, signalling a shifting insolvency landscape.
Interest rate cuts bring relief but not a cure – While recent RBA cuts are beginning to support households and businesses, rising energy costs, wages and global trade headwinds mean insolvencies are expected to stay high in the months ahead.
Western Sydney the insolvency hotspot – Six of Australia’s 10 worst-performing regions are in Western Sydney, driven by lower household incomes, high concentrations of small construction businesses and elevated personal insolvency rates.
The July Business Risk Index from leading credit reporting agency CreditorWatch reveals a duality in the Australian business landscape with certain sectors and regions showing resilience while others continue to struggle.
The data also shows that conditions in some of the worst performing sectors have begun to stabilise, while prior out-performers are recording some deterioration. While CreditorWatch has been optimistic about a stabilisation in insolvencies at elevated levels, rather than an outright improvement, we are carefully monitoring a renewed jump in B2B invoice defaults in July. This may warn of a further rise in insolvencies.
CreditorWatch CEO Patrick Coghlan says, “While some sectors and regions are doing very well, the warning lights are flashing for sectors highly exposed to discretionary spend, and small businesses facing persistent cash flow pressure.
“An additional concern is the slight lift in in insolvencies and payment defaults in sectors that are traditionally low risk, like Financial and Insurance Services and Healthcare and Social Assistance.
“We expect the RBA’s recent interest rate cuts to provide some support to both consumers and businesses over the coming months, and hope to see further interest rate reductions over the next six months.”
National insolvency trends
Insolvency data for July 2025 again reveals an elevated but generally stable level of insolvencies, a trend that emerged over the first half of 2025. The stabilisation at relatively high levels reflects a similar stabilisation in the trends for trade payment defaults and new ATO tax default numbers, though payment defaults jumped in July.
On the macroeconomic side, companies and consumers benefited from the July 2024 income tax cuts and some slowing in the rate of cost and price increases.
The RBA’s interest rate cuts from February and May, are beginning to help to some degree, with the further cut in mid-August to be beneficial in coming months.
Companies entering insolvency for the first time
Seasonally adjusted, as at 31 July 2025
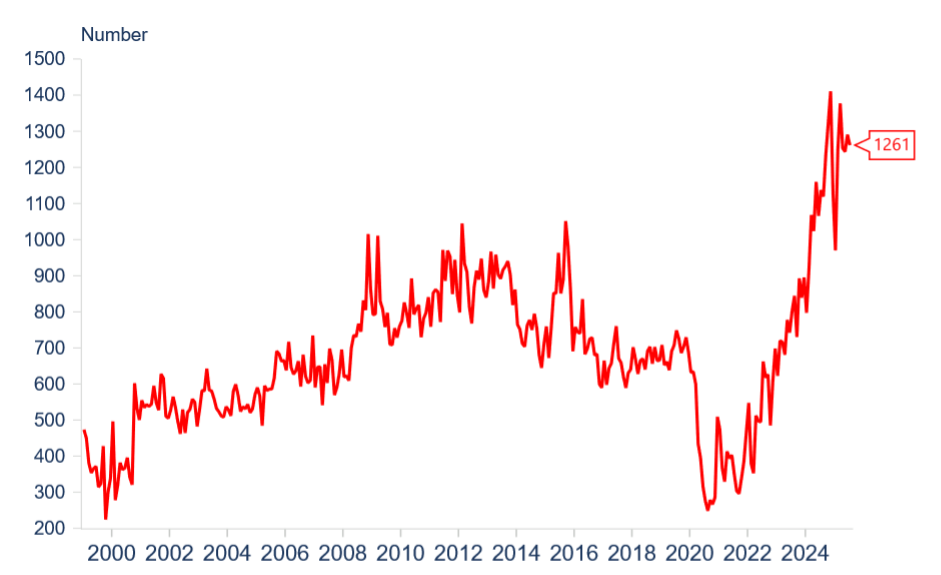
Data sources: CreditorWatch, ASIC, Macrobond
Trade payment defaults jump in July
Running somewhat contrary to the other signals of stabilisation in business conditions, CreditorWatch’s trade payment defaults data – along with ATO payment defaults one of the stronger indicators of future insolvency – jumped in July and early data for August suggests this slightly higher level of defaults is being maintained.
This is a warning of continuing rather than reducing pressures on businesses, and suggests some further deterioration in insolvencies may occur, though the number of B2B invoice payment defaults has not exceeded the peaks of late 2024.
Trade Payment Defaults – All Sectors
July 2025 (February 2020 = 100)
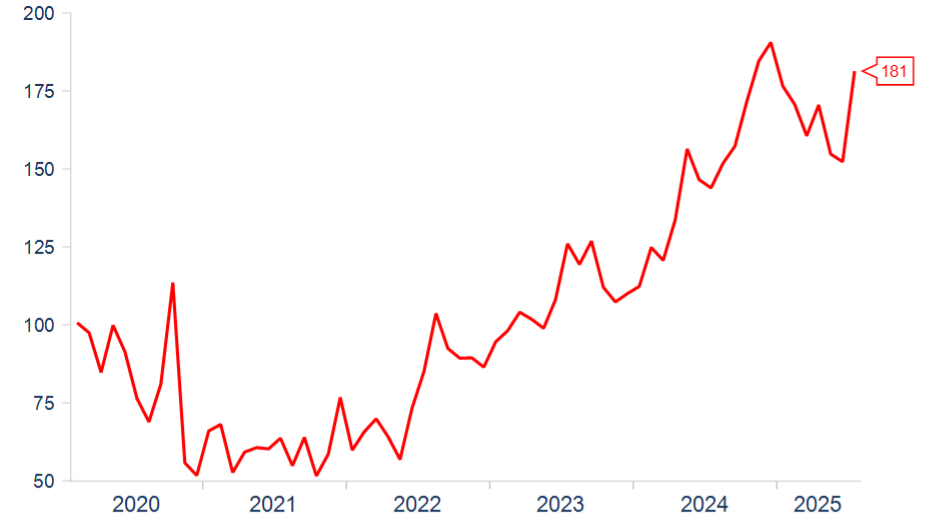
Data sources: CreditorWatch, Macrobond
Industry insights for July
Looking at the trends for both insolvencies and payment defaults, while these remain generally elevated for Construction and Hospitality – the two largest contributors to total insolvency numbers in recent years – it has been the deterioration in other sectors that has mainly accounted for the renewed uptick in trade payment defaults in July.
Increased payment defaults were recorded against companies in the Retail Trade; Transport, Postal & Warehousing; Healthcare & Social Assistance; and Professional, Scientific and Technical Services sectors.
Business closure rates (insolvencies, plus voluntary deregistrations and ASIC strikeoffs) have been highest over the past year as a share of operating businesses in Hospitality, Administrative & Support Services and Transport, Postal & Warehousing. Companies in Agriculture, Forestry & Fishing, Financial & Insurance Services and Healthcare & Social Assistance have experienced low rates of business closure.
Business Closure Rates
12 Months to July 2024 vs 12 Months to July 2025

Data sources: CreditorWatch, ASIC intra-day feed
Recent insolvency data reveal some rotation in these trends, with insolvencies generally plateauing in the previously worst performing sectors, while insolvencies have lifted a little in Financial and Insurance Services and Health Care and Social Assistance (though the rate would remain relatively low as a share of operating businesses). Pleasingly, insolvencies remain extremely low in Agriculture, Forestry and Fishing.
Insolvency Trends – Worst Performing Sectors 2024-25

Data sources: CreditorWatch, Macrobond
Normally when insolvencies increase, the unemployment rate does as well. In this cycle, that relationship has been less in evidence. This likely reflects the fact that a significant proportion of insolvencies have involved small businesses, in part due to the increasing use of Small Business Restructuring (SBR) arrangements. In 2024-25, some 2,918 restructuring arrangements were entered into, nearly 20% of total insolvencies for the financial year.
Insolvency Trends – Best Performing Sectors 2024-25

Data sources: CreditorWatch, Macrobond
Regional risk landscape
Geography remains a decisive factor in relative business resilience.
Best-performing regions (5,000+ businesses)
- Certain inner-metro Adelaide, regional Victoria and North Queensland regions continue to record low risk scores, supported by lower-than-average competition, low levels of personal insolvency, and higher-than-average incomes (due largely to the higher-than-average age of the populations).
Highest risk regions (5,000+ businesses)
- Outer metro growth corridors with lower average incomes, high concentrations of small businesses (especially in construction) and higher levels of personal insolvency, such as Western Sydney, are showing elevated business insolvency rates. In fact, six of the 10 worst performing regions in Australia are in Western Sydney.
- Tourism-dependent regions are under some strain due to weaker domestic travel spend.
Our outlook
CreditorWatch Chief Economist Ivan Colhoun says, “The elevated level of insolvencies reflects a complex set of pressures impacting companies. Common macro themes include significantly higher input costs including, importantly, energy prices, tight monetary policy and weaker discretionary spending as consumers, like businesses, are impacted by the higher cost of living and the lagged effect of previous higher interest rate settings.
“The latest reduction in interest rates by the RBA will, in time, be beneficial to both consumers and businesses, however, domestic energy prices and wages continue to rise, while US trade policy is expected to slow global growth. This is expected to keep the level of insolvencies relatively elevated in the foreseeable future.
“The Government’s recent Productivity Roundtable could make useful contributions to business by focusing on measures to reduce red tape and speed up approvals which are hindering productivity in the large Finance and Insurance, Mining, Education, and Construction sectors, each of which have recorded declining productivity in recent years.
“The other large sectors where productivity could likely be improved include Public Sector Administration and Healthcare and Social Assistance. At the same time, businesses also have a responsibility to do what they can to improve their own productivity.”
Subscribe for free
Subscribe for free here to receive the monthly Business Risk Index results in your inbox on the morning of release. No spam.
Business insights
business risk index
Cash Flow
Chief Economist
Credit Management
data
defaults
hospitality
insights
insolvencies
insolvency
insurance
Interest Rates
Trump

Chief Economist
Ivan joined CreditorWatch as Chief Economist in October 2024. He is a highly experienced chief economist and keynote speaker on the economy and financial markets.
Most recently, Ivan was Chief Economist, Corporate & Institutional Banking for National Australia Bank, but has also been Chief Economist for Qantas and Chief Economist (Australia) for ANZ and Deutsche Bank. Ivan has also consulted to SEEK, IATA and Virgin Australia.
Ivan holds a Bachelor of Economics with Honours from the University of Tasmania and commenced his career at the Reserve Bank of Australia.
14-Day Free Trial
Get started with CreditorWatch today
Take your credit management to the next level with a 14-day free trial.