KEY TAKEAWAYS:
East-coast capitals under the pump: Sydney and Brisbane lead the nation in business failures, each posting a 5.82% failure rate for the year to November, with Melbourne close behind at 5.55%. Sydney’s rock-bottom Business Risk Index score of 25 versus Regional SA’s 87 tells the story: soaring rents, property costs, and spiralling premiums, wages and utilities are squeezing SMEs to breaking point.
SMEs squeezed from all sides: High commercial rents, surging insurance bills, wage and energy hikes, and cost-of-living pressures are pressuring cashflow. With consumers tightening belts, demand is soft and payment defaults are near record highs. The warning? If the RBA hikes rates in early 2026, the pressure will intensify.
Winners and losers by postcode: Not all regions are hurting. Perth’s 3% growth, powered by mining investment, migration and infrastructure, contrasts sharply with NSW and Queensland’s struggles. Adelaide’s construction boom, Hobart’s retail and tourism revival, and Melbourne’s post-COVID bounce in health and professional services show geography matters.
Country calm amid city storms: Regional Australia is proving resilient: failure rates run about 13% lower than in capital cities. Anchored by agriculture, mining, health and education, and cushioned by lower rents and utilities, regional operators enjoy a buffer from the high-churn sectors driving CBD insolvencies.
A flatline with a pulse – and an anxious outlook: National insolvencies aren’t spiralling, but they’re not easing either. Trade defaults remain elevated, tax defaults flat, and the Economic Conditions Tracker hovers near its long-run average. Beneath the calm lurks tension: sticky inflation, the spectre of an RBA rate rise, and early-warning signs that defaults precede insolvencies. The era of improving conditions may be ending, according to CreditorWatch Chief Economist, Ivan Colhoun.
CreditorWatch’s November Business Risk Index results reveal business failure rates across 2025 have been highest across the three eastern states of NSW, Queensland and Victoria.
On a capital-city basis, high commercial rents and property prices in Sydney and Brisbane have placed a major strain on SMEs in particular, in addition to cost pressures such as increases in insurance premiums, wages and utilities.
While all state capitals saw a lift in business failures over the past year, businesses in Greater Sydney and Greater Brisbane both experienced failure rates of 5.82% in the 12 months to 30 November 2025, up from 5.48% and 5.18% in November 2024, respectively. In contrast, Melbourne recorded 5.55%, Hobart 5.07%, Adelaide 4.73% and Perth 4.70% in the twelve months to 30 November 2025.
Despite Sydney and Brisbane currently having the highest rates of business failure in the nation among state capitals, rates of failure are starting to level off – as they are in Perth. Failure rates in the other state capitals continue to increase. Sydney’s failure rate growth was the second lowest of the capital cities in the 12 months to November 2025, after Perth. Hobart had the highest, followed by Brisbane.
Business failure rate – State capital cities
Nov 2025 vs Nov 2024
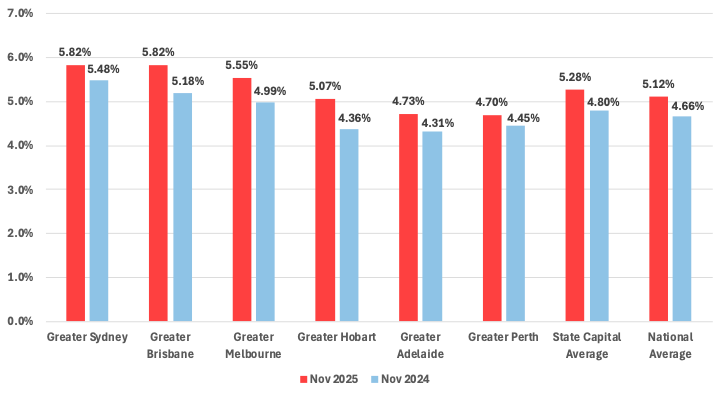
Data sources: CreditorWatch, ASIC
CreditorWatch CEO Patrick Coghlan says, “Our Business Risk Index highlights a clear divergence: larger capitals like Sydney and Brisbane still lead in failure rates, but their growth trajectory is flattening compared to Hobart and Adelaide. These cities’ smaller, steadier business environments shield them from the volatility seen in larger capitals.
“However, the key underlying pressures – high costs, subdued demand and tight margins – are far from resolved. Businesses need to remain vigilant and proactive in managing risk as these financial pressures will remain throughout 2026, particularly if the RBA raise interest rates to bring inflation under control.”
City by city
Australia’s capitals have navigated 2025 with varied momentum. Perth stands out as a growth engine, powered by migration, mining investment, and infrastructure upgrades that have lifted jobs and spending.
Adelaide has leveraged its stable service base and construction surge to maintain steady expansion, while Hobart has thrived on record retail activity and a tourism revival. Melbourne’s recovery from pandemic-era setbacks continues, supported by strong labour demand in healthcare and construction.
Brisbane has shown improving confidence but faces cost pressures and payment strains. Sydney remains a national hub, yet elevated operating costs for businesses, particularly the highest commercial rents in the country, and rising insolvencies are testing resilience across key sectors. SMEs, which operate at tighter margins that larger businesses, are finding it especially tough.
A summary of each city is available below:
Perth
Perth’s economy has been particularly strong over the past 12 months, driven by robust population growth, high employment and strong consumer demand. The city has benefited from ongoing mining investment, which supports a large share of metropolitan jobs in engineering, services and logistics.
Strong migration has lifted housing demand, pushing up construction activity, property prices and retail spending. The unemployment rate remains among the lowest nationally, boosting household confidence and spending across discretionary sectors like hospitality and retail. Major infrastructure projects, such as the Metronet rail program, and a growing tech and innovation sector have also added momentum.
Adelaide
Adelaide’s strong performance has been driven by a surge in construction, housing development, and infrastructure projects supported by a stable economic base dominated by government, defence, education and health services. Its smaller, steadier business environment also shields it from the volatility seen in larger capitals.
Like Perth, population growth and rising migration have boosted demand for residential and commercial property, driving construction activity and associated jobs. The services sector – particularly healthcare, education, finance, and professional services – has expanded, providing stable employment and supporting consumer spending.
South Australia’s mining and renewable energy industries, including copper, gold, and solar projects, have added further economic momentum.
Hobart
Hobart has benefited from a buoyant labour market, supporting incomes, consumer spending and stability. Retail trade and local spending have hit record highs, reflecting solid demand despite wider economic headwinds. Meanwhile, the city’s tourism and visitor economy have rebounded strongly with visitor numbers to Hobart reaching 1.3 million by March 2025, generating substantial employment and activity across hospitality, food, retail and culture.
Melbourne
Melbourne’s economy was negatively affected by extended COVID lockdowns but has since recovered strongly. Across 2025, employment and labour‑force participation remain high, with metropolitan Melbourne seeing strong job growth across sectors such as Healthcare and Social Assistance, Construction and Professional Services.
Demand for labour is expected to remain elevated over the next few years, particularly in the Healthcare and Construction sectors.
Brisbane
Business confidence and jobs growth have recently ticked up in Brisbane but as with businesses in most regions around the country, cost pressures, tight margins and low productivity are challenging profitability.
Brisbane has also experienced relatively high B2B default rates and pressure from rapid population growth and construction constraints.
Sydney
Sydney’s economy has shown some resilience across 2025 with relatively stable demand in services and ongoing infrastructure activity, buttressed by a large population and its status as a national commercial hub. However, business failures, particularly in Western Sydney, continue to rise.
Businesses in Sydney face the highest operating costs in the country, combined with elevated office vacancies and reduced foot traffic, all of which are straining cashflow.
Rising costs – especially energy, rent, labour and inputs – combined with cost‑of‑living pressures have squeezed margins in sectors like retail, hospitality and construction. Many firms have faced payment delays and declining discretionary spending. Smaller businesses operating on tighter margins bear significant strain, pushing up insolvencies and closures across vulnerable sectors.
City vs country
Failure rates in regional areas average about 13% lower than in major cities, largely due to structural advantages that create more stable trading conditions. Regional markets are less saturated, so businesses face far less competitive pressure than their metropolitan counterparts. Lower operating costs – especially rent, labour and utilities – also give operators greater financial resilience when conditions soften.
The CreditorWatch Business Risk Index rankings of greater capital cities and state regions, show a significant difference between the lowest risk region, Regional South Australia, with a score of 87 on the index and the highest, Sydney, which has a score of 25.
Demand in regional economies is steadier, supported by anchor industries such as agriculture, mining, health and education, which provide consistent employment and spending. Strong customer loyalty and long-standing business relationships further support stability, contributing to a higher share of well-established businesses with lower failure risk.
Regional areas also have fewer high-risk, high-churn sectors like CBD hospitality, retail strips and fast-growth startups, which drive much of the insolvency activity in capital cities. Combined with generally more conservative borrowing and expansion practices, these factors create a more predictable, less volatile operating environment for regional businesses.
Business failure rate – State regions
Nov 2025 vs Nov 2024
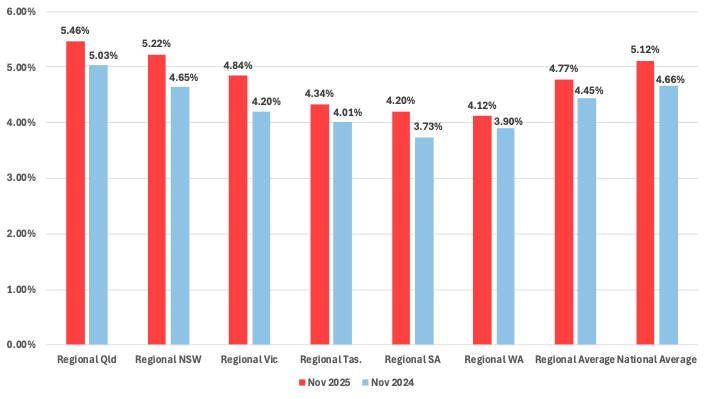
Data sources: CreditorWatch, ASIC
State by state
As with the capital city analysis, CreditorWatch’s state-by-state analysis highlights contrasting fortunes across the states. Across 2025, Australia balanced resource-driven strength with pockets of economic vulnerability.
Western Australia led the mainland with robust 3.4% growth in GDP, driven by mining and record household consumption. South Australia surged on construction, housing investment and multi-decade low unemployment, while Tasmania maintained resilience with record-low joblessness and strong retail trade.
Victoria posted steady growth supported by infrastructure and jobs, though rising costs pressured SMEs. In contrast, New South Wales and Queensland faced greater pressures, evident in higher insolvency rates and elevated payment defaults.
Business failure rate – State by state
Nov 2025 vs Nov 2024
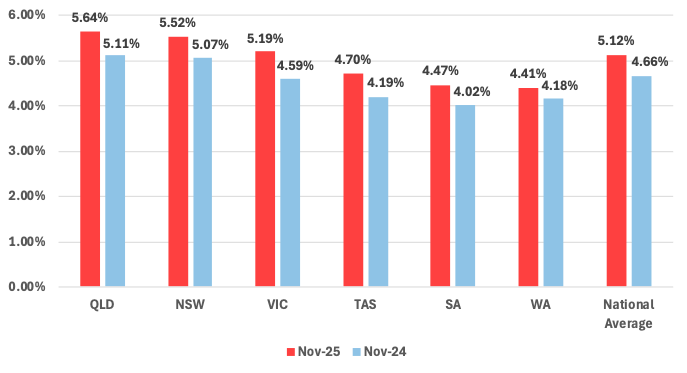
Data sources: CreditorWatch, ASIC
A summary of each state is available below:
Western Australia
The WA economy was the strongest performing of the mainland states across 2024/25 with three per cent growth, reflected in a significant contribution from the resources sector. The WA mining industry had a near-record number of full-time positions, with a strong pipeline of mine production and construction activity. Sales of gold, iron ore, mineral sands, alumina and liquefied natural gas (LNG) were also up.
The state also enjoyed the highest growth of household consumption in 2024/25, experienced low rates of B2B payment defaults and saw a 25% increase in building completions.
South Australia
South Australia’s economy is performing well thanks to a surge in construction and housing investment, buoyant consumer spending and robust job creation. Residential building-starts and dwelling investment are among the highest in the nation.
At the same time, services industries such as finance, healthcare and social assistance have added significantly to growth. The resources sector, particularly mining and mineral production, remains an important underpinning, contributing substantially to output and employment. These factors have helped push unemployment to multi-decade lows.
Tasmania
Tasmania’s economy has shown resilience with unemployment at a record low around 4% – among the lowest in the country. Gross State Product recently hit a record $40.6 billion, with demand and household spending both strong.
Retail trade has repeatedly reached new highs, reflecting consumer confidence and spending. Exports – including agriculture, aquaculture and mining/processes – alongside growing equipment and private-sector investment have also contributed to steady growth.
Victoria
Victoria’s economy remained resilient in 2024‑25, supported by strong job creation, rising business investment, and major infrastructure projects. Gross State Product grew about 1.5 %, while wages and labour‑force participation remained near record highs. However, rising input costs, tighter credit conditions, and slowing consumer demand have contributed to an increase in business‑failure rates, particularly among small and medium enterprises in retail, hospitality and construction sectors. Overall, growth is positive but uneven.
New South Wales
The NSW economy has faced subdued conditions over the past year, with business insolvencies plateauing at historically high levels. Challenging trading conditions – from weakening consumer demand to rising costs – have led to more businesses defaulting on payments and struggling to pay suppliers. As a result, NSW’s business failure rate is now among the highest in Australia.
This is largely driven by persistently high costs and pockets of stress (e.g. Western Sydney), where many small businesses contend with lower household incomes, high rents, and elevated personal insolvency rates.
Queensland
The Queensland economy has shown positive signs over the past year – business confidence has increased and infrastructure investment has been strong. However, sluggish consumer demand and higher costs have squeezed cashflow for many businesses, leading to higher payment defaults and business closures.
As a result, Queensland’s business failure rate is the highest in Australia. This reflects persistently high costs of doing business and pockets of stress (such as those in South-East Queensland) where many small businesses face lower household spending, high rents and still-elevated construction costs.
National insolvency, trade payment default and ATO tax debt default trends
Insolvencies dropped back in November and appear to be oscillating around a flat or gradually improving trend. Insolvencies remain well below the levels of late 2024 and around the levels that have applied for much of the second half of 2025.
At a sector level, insolvencies have risen in Transport, Postal and Warehousing, Retail Trade and Manufacturing and remain elevated – but stable – in Construction. There have been encouraging improvements in recent months in insolvencies in Wholesale Trade and Food and Beverage Services.
Most data suggest a broadly sideways trend for insolvencies in the next few quarters. Given factors such as the number of new companies with tax debts in excess of $100,000, is oscillating around a broadly flat trend.
However, trade payment defaults – one of the best early warning indicators of potential insolvency – provide for some caution to this assessment. Payment defaults eased slightly in November but remain near the highest levels recorded, which suggests many firms continue to experience financial pressure.
Economic Conditions Tracker
CreditorWatch’s Economic Conditions Tracker continues to report an improvement in economic conditions over the past 12 to 18 months to a level around long-run average conditions. This average however combines the positive of lower-than-average unemployment and below average levels of family finances. It reflects cost of living pressures, coexisting with favourably low unemployment.
The outlook
CreditorWatch Chief Economist Ivan Colhoun says, “It’s likely that the period of improving economic conditions may be coming to an end as higher inflationary readings in late 2025 halt interest rate reductions and increase the risk of an earlier return to higher interest rates in 2026.
“The RBA Board signalled in early December that it would be closely monitoring upcoming inflation data for evidence that above-target inflation was persisting. This suggests a higher-than-expected Q4 CPI could see an interest rate increase as early as the February Board Meeting.
“If realised, this would likely reimpose financial pressures on many households and businesses and contribute to less favourable business and credit conditions. One possible offset might be an emerging upturn in parts of the Mining sector due to much higher prices for some commodities such as gold, silver and copper. Overall, these developments suggest that the rate and level of insolvencies will likely remain somewhat elevated in the year ahead.”
Subscribe for free
Subscribe to the Business Risk Index for free to receive the monthly results in your inbox on the morning of release. No spam.
Business insights
business risk index
Cash Flow
Chief Economist
Credit Management
data
defaults
hospitality
insights
insolvencies
insolvency
Interest Rates
Trump

Head of Media & Communications
Michael joined CreditorWatch in July 2021. He has more than 20 years’ experience in business journalism, marketing and communications strategy, and digital content development. He is passionate about communicating to the business community how CreditorWatch’s products can help them identify risk earlier, and make smarter decisions. He has previously written for Newscorp, Nine publishing, ACP Magazines and the World Economic Forum. He holds Bachelor of Communications and Master of Journalism degrees from the University of Technology, Sydney.
14-Day Free Trial
Get started with CreditorWatch today
Take your credit management to the next level with a 14-day free trial.
