The Business Risk Index (BRI) is a ground-breaking new economic indicator that provides unique insights into the health of Australian businesses by region. It draws on a wide range of data points to produce a dynamic measure of future insolvency risk for more than 300 regions across Australia.
The BRI ranks each region on a scale from zero to 100, where 100 represents the best credit quality regions, that is, the lowest risk of insolvency, and zero represents the weakest credit quality regions, that is, the highest insolvency risk.
The model brings together a collection of traditional and cutting-edge algorithms to which the data is applied, including a new modelling technique for predicting insolvency risk on pools of businesses in geographic regions.
This is the first time forward-looking insolvency risk has been measured in this way.
How is the index constructed?
The BRI draws on an array of different data sources. These include the data CreditorWatch compiles about Australian businesses, as well as data from 1.1 million ASIC-registered, incorporated entities that have had credit checks or credit enquiries in the last 10 years. Data is modelled on support measures and reported for more than 300 regions that match the Australian Bureau of Statistics’ regional reporting standard.
The BRI is also determined by unique data sources including business-to-business trade payments, business cash flow and geodemographic risk. Geodemographics classify geographical areas by their social and economic characteristics. The model combines real-time, dynamic factors unique to CreditorWatch, as well as traditional, structural economic indicators, to provide an holistic assessment of long-run insolvency risk.
Our data science and credit risk teams draw on this data to work out the probability of insolvency. The insolvency process includes trends which are brought together using statistical modelling techniques combined with economic analysis, so each business and region’s data quantifies its estimated probability of insolvency.
What is the BRI’s value to the Australian economy?
This is the first time an index has been developed that is forecasting insolvency risk on a regional basis and we expect the BRI to become an invaluable early warning system for a range of circumstances including positive and negative regulatory economic impacts.
For instance, the BRI will help businesses making expansion plans to determine which regions are the most economically healthy. It will help lenders when making decisions about areas to which they want to increase and decrease exposure in order to increase profitability. The data will also help the Australian government, their departments and agencies when making public policy decisions about which areas require support and services.
It’s an invaluable and one-of-a-kind measure to support the Australian economy as a whole.
Case studies on best and worst performing regions
Case study: Gold Coast North
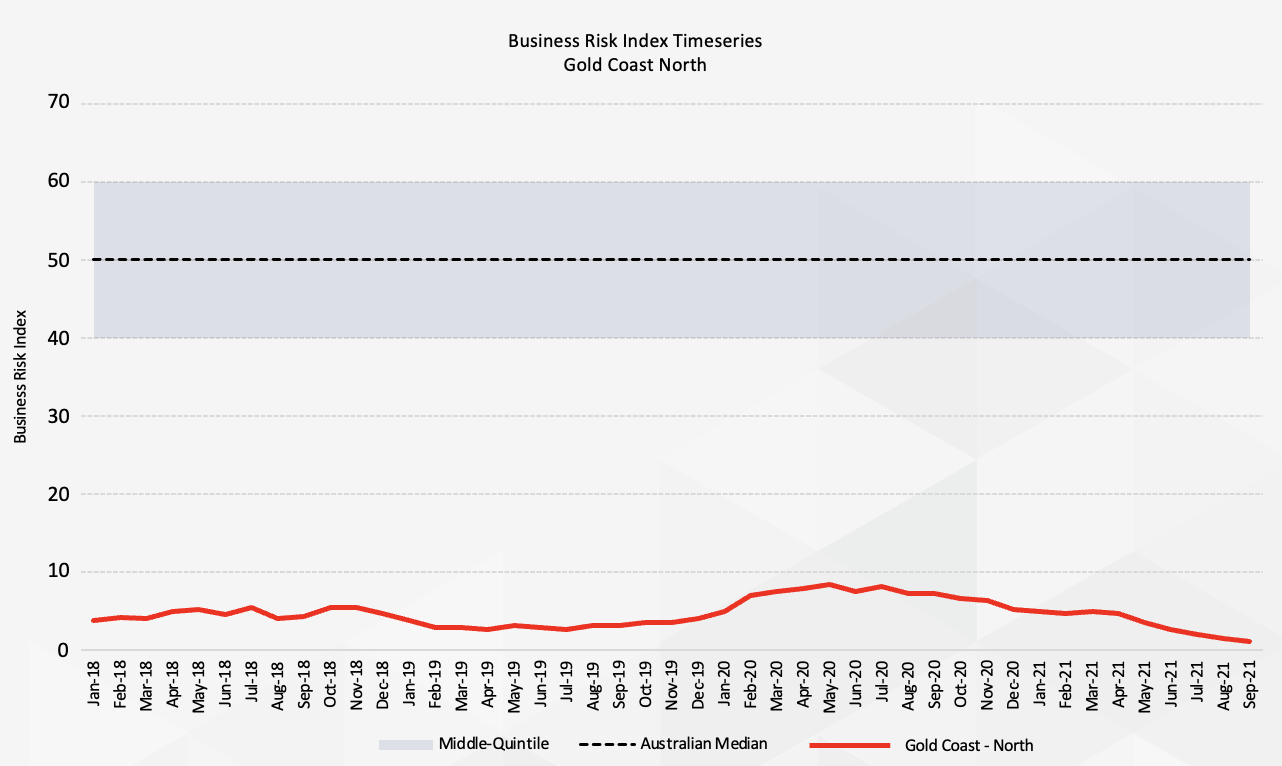
Gold Coast North is a high-risk business region, consistently in the bottom 10 per cent of all regions as shown below.
Two factors contribute to the low rating:
- Dynamic indicators including trade payment defaults, regional average credit scores and recent default rates all indicate near-term stress and financial distress in the region.
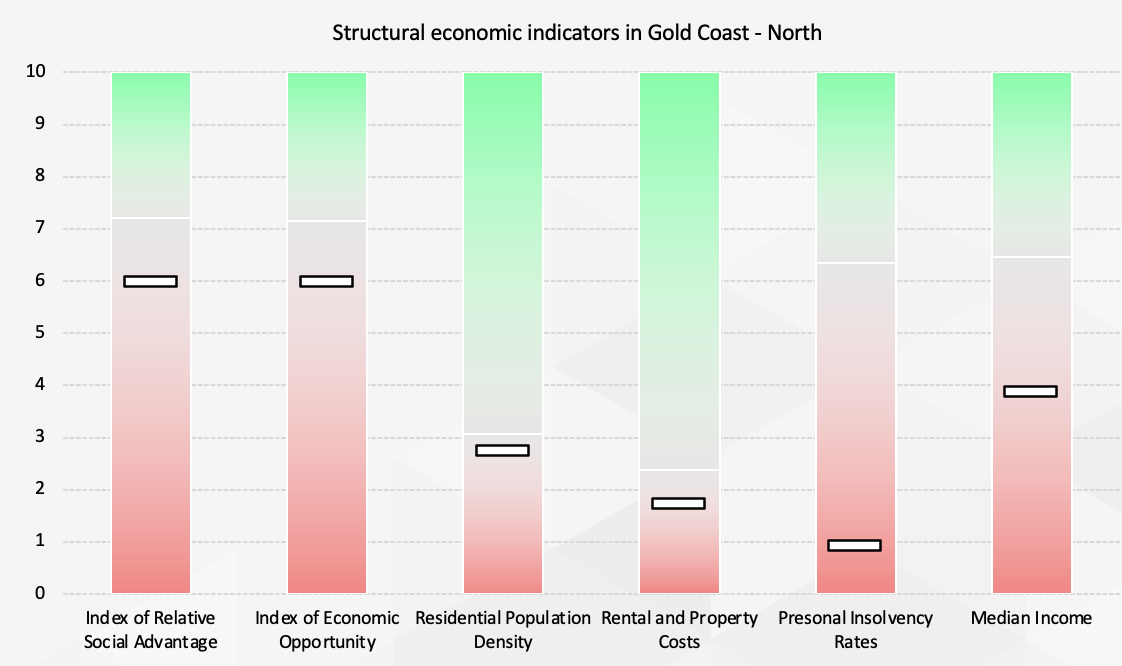
- Structural economic drivers such as relative rental costs, unemployment and socio-economic indicators point to challenging conditions to operate businesses throughout the economic cycle.
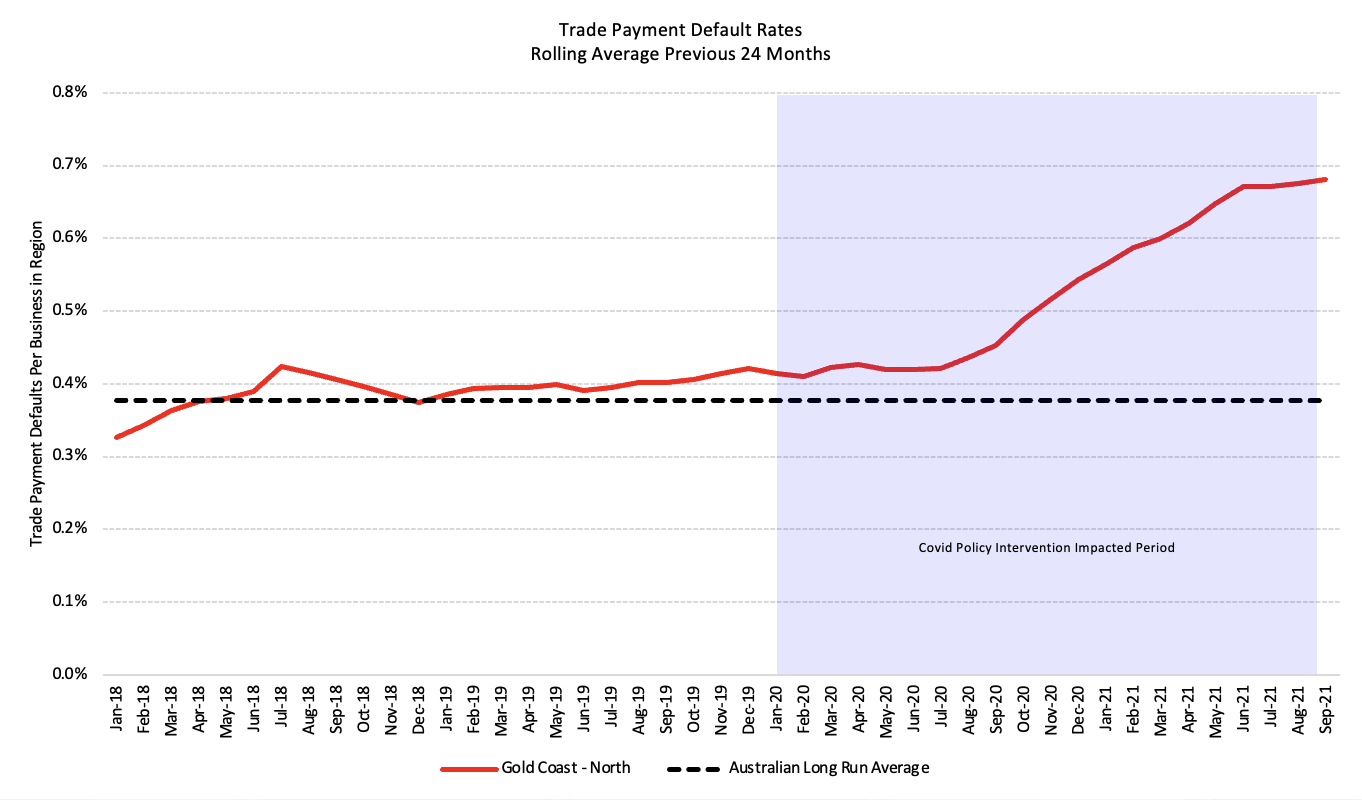
The chart below shows the rolling 24-month average business-to-business trade payment default rate for Gold Coast North, indicating a recent increase in defaults and economic downturn.
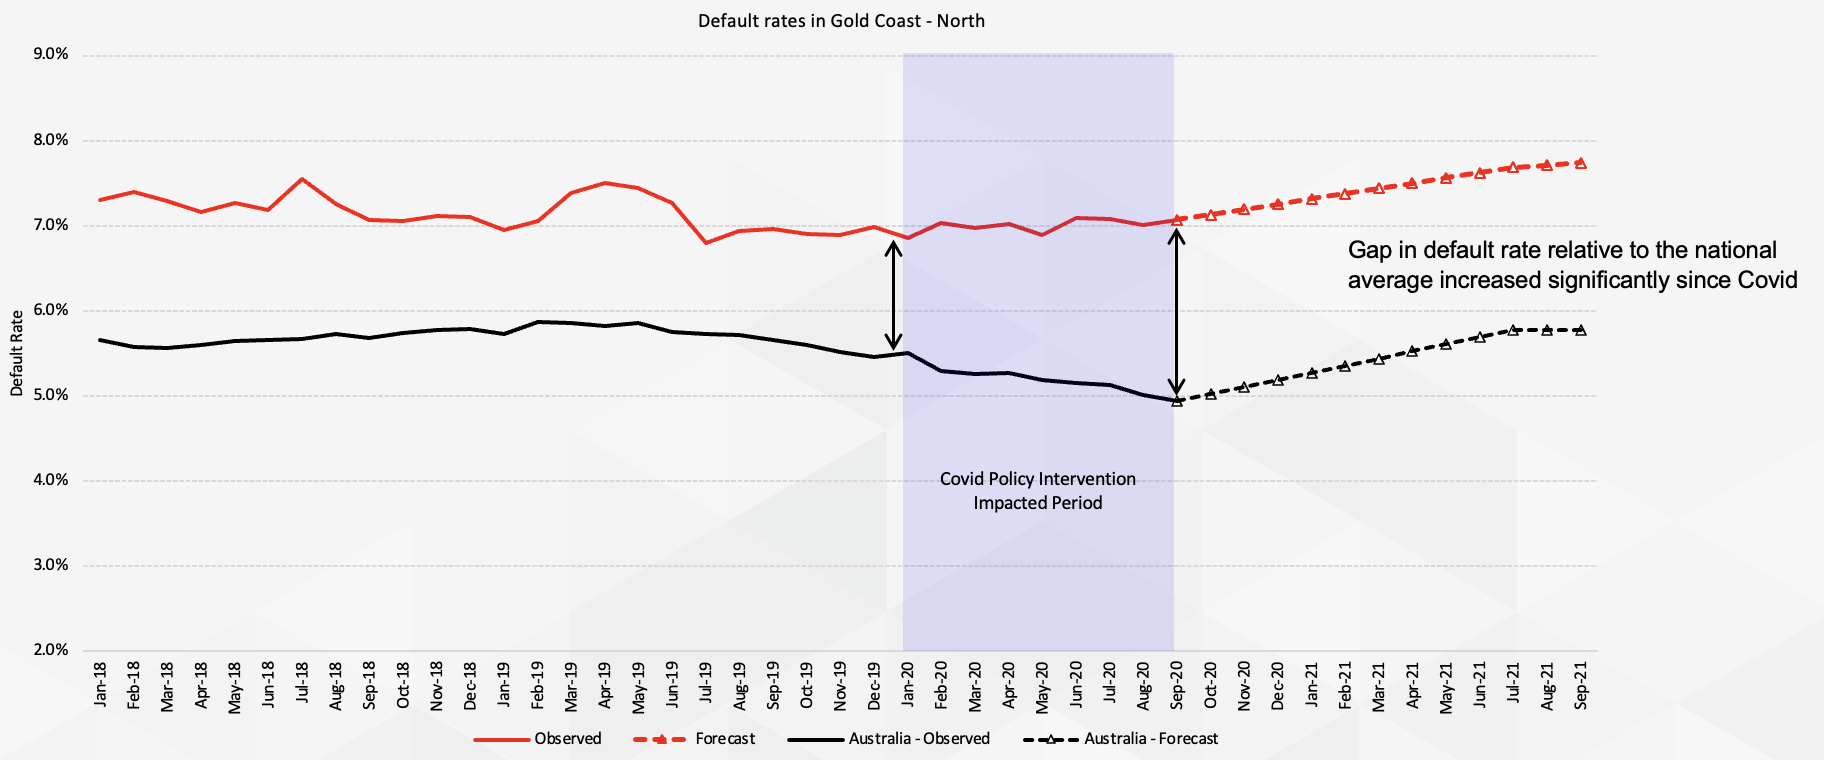
The chart below shows the 12-month, rolling average liquidation rate for Gold Coast North indicating elevated recent insolvencies in a period where insolvency rates nationally had been dropping due to government support and the moratorium on insolvencies.
The chart below shows Gold Coast North’s structural economic indicator ranking relative to the rest of Australia for key economic factors contributing to the business risk index.
Case study: Adelaide Hills
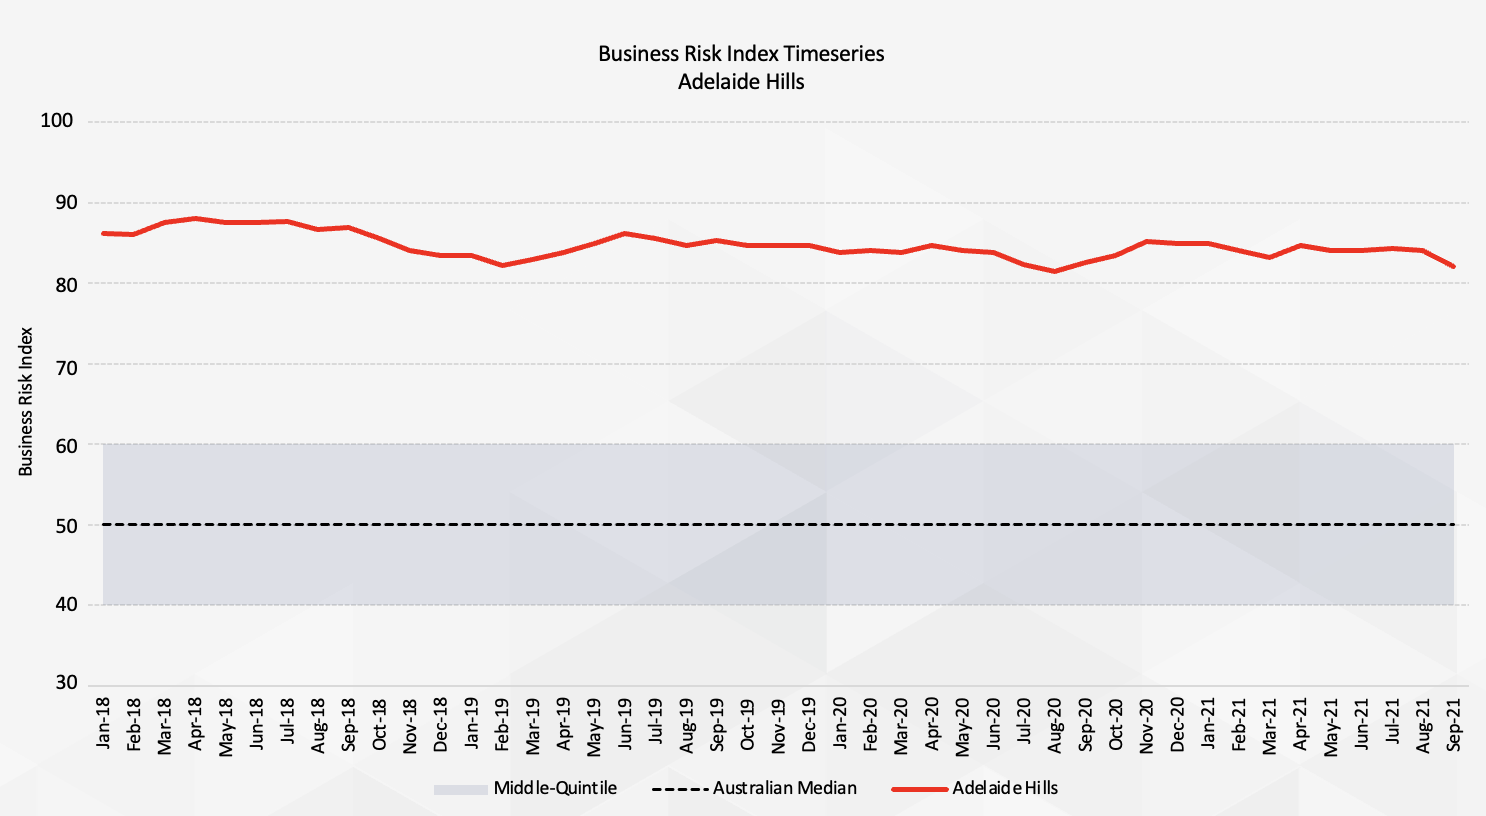
Adelaide Hills is an example of a region with an above average business risk index, consistently in the top quintile (BRI > 8.0).
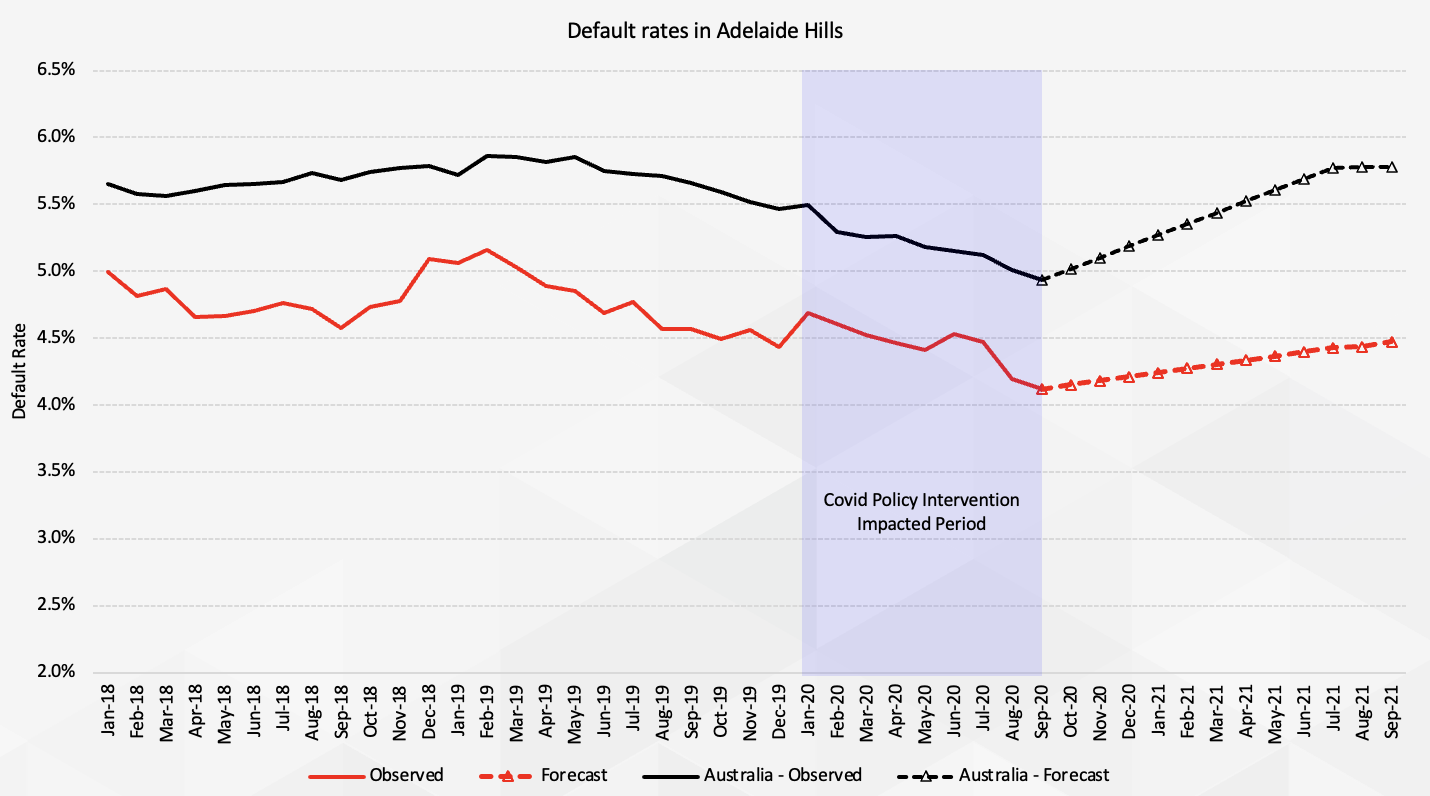
The chart below shows the 12 month rolling average liquidation rate for Adelaide Hills. Default rates have tracked consistently below the national average.
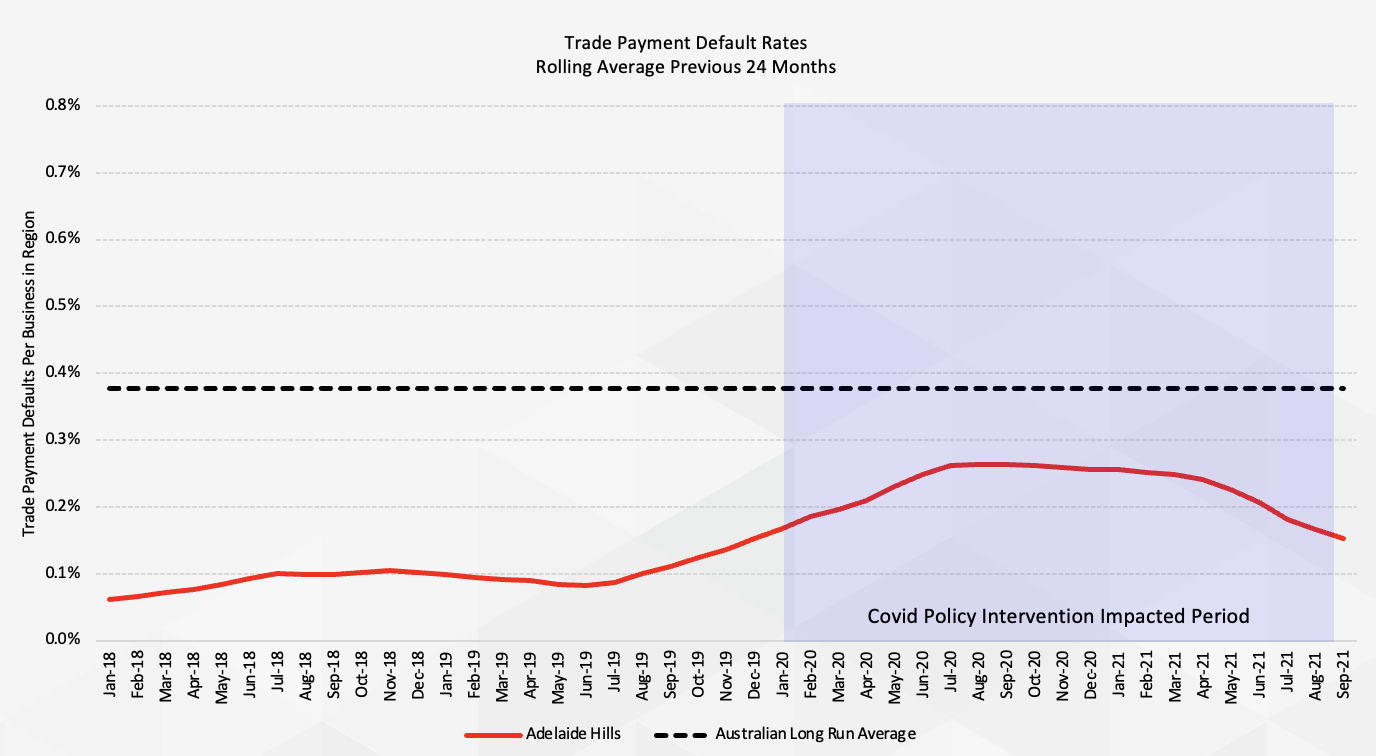
The chart below shows the rolling 24-month average business-to-business trade payment default rate for Adelaide Hills, indicating a moderate increase in defaults, however well below the national average.
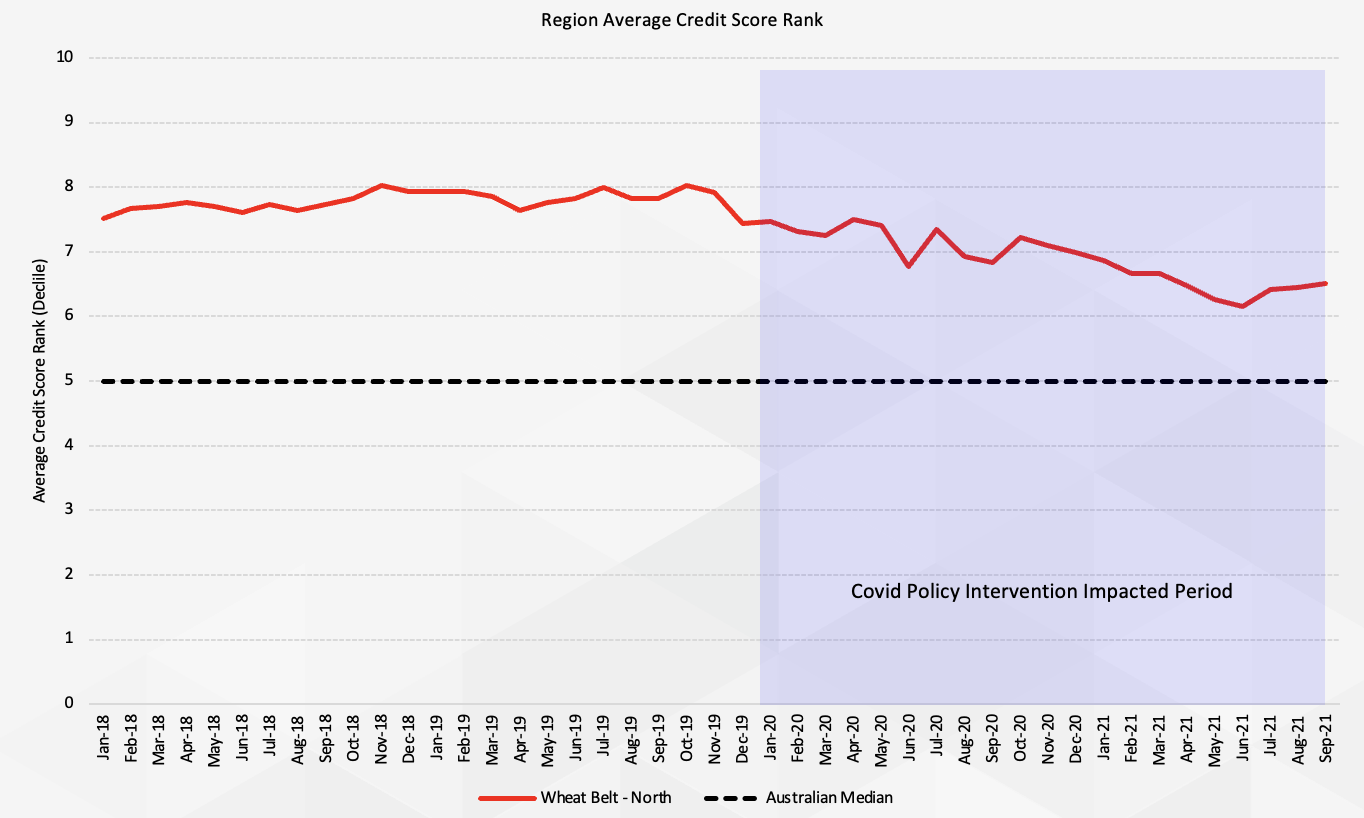
The chart below shows the regional average credit score ranking for Adelaide Hills.
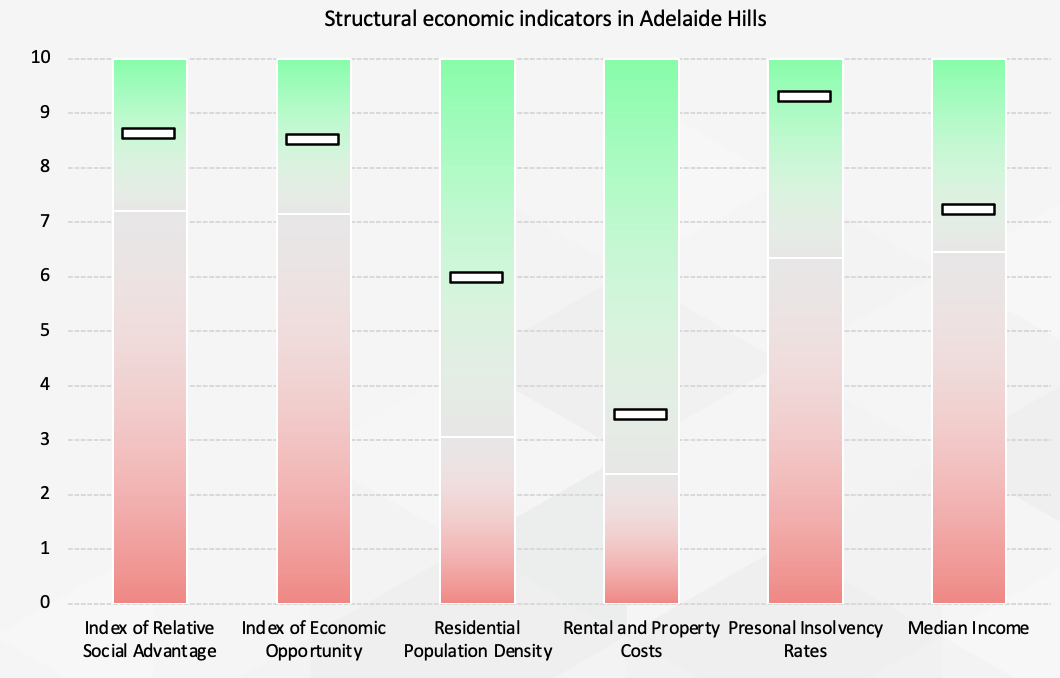
The chart below shows Adelaide Hills structural economic indicator ranking relative to the rest of Australia for key economic factors contributing to the business risk index.
Adelaide Hills has a combination of high relative wealth and socio-economic status, low personal insolvencies and moderate rental prices.
Case study: Northern Wheat Belt Western Australia
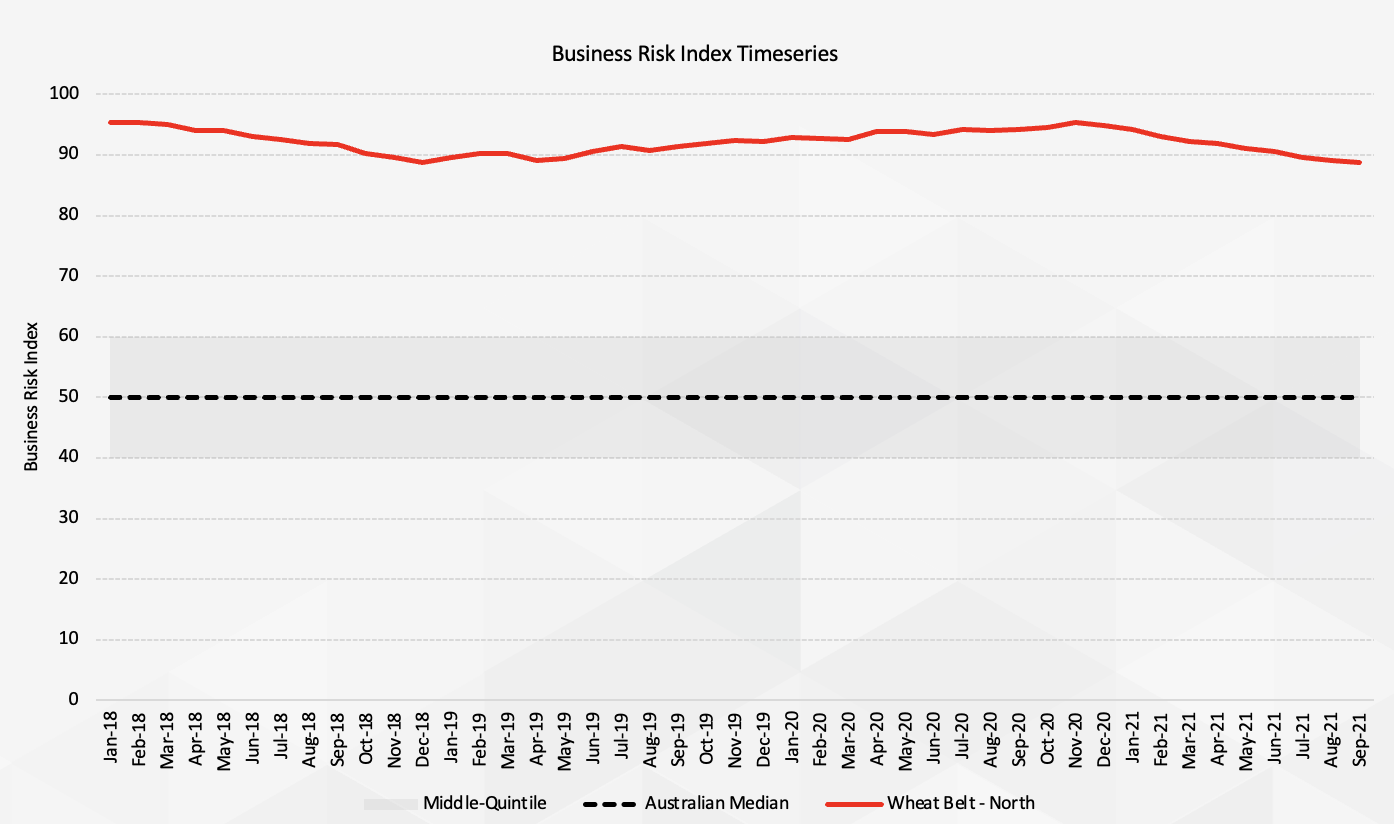
The chart below shows the Business Risk Index timeseries for Wheat Belt.
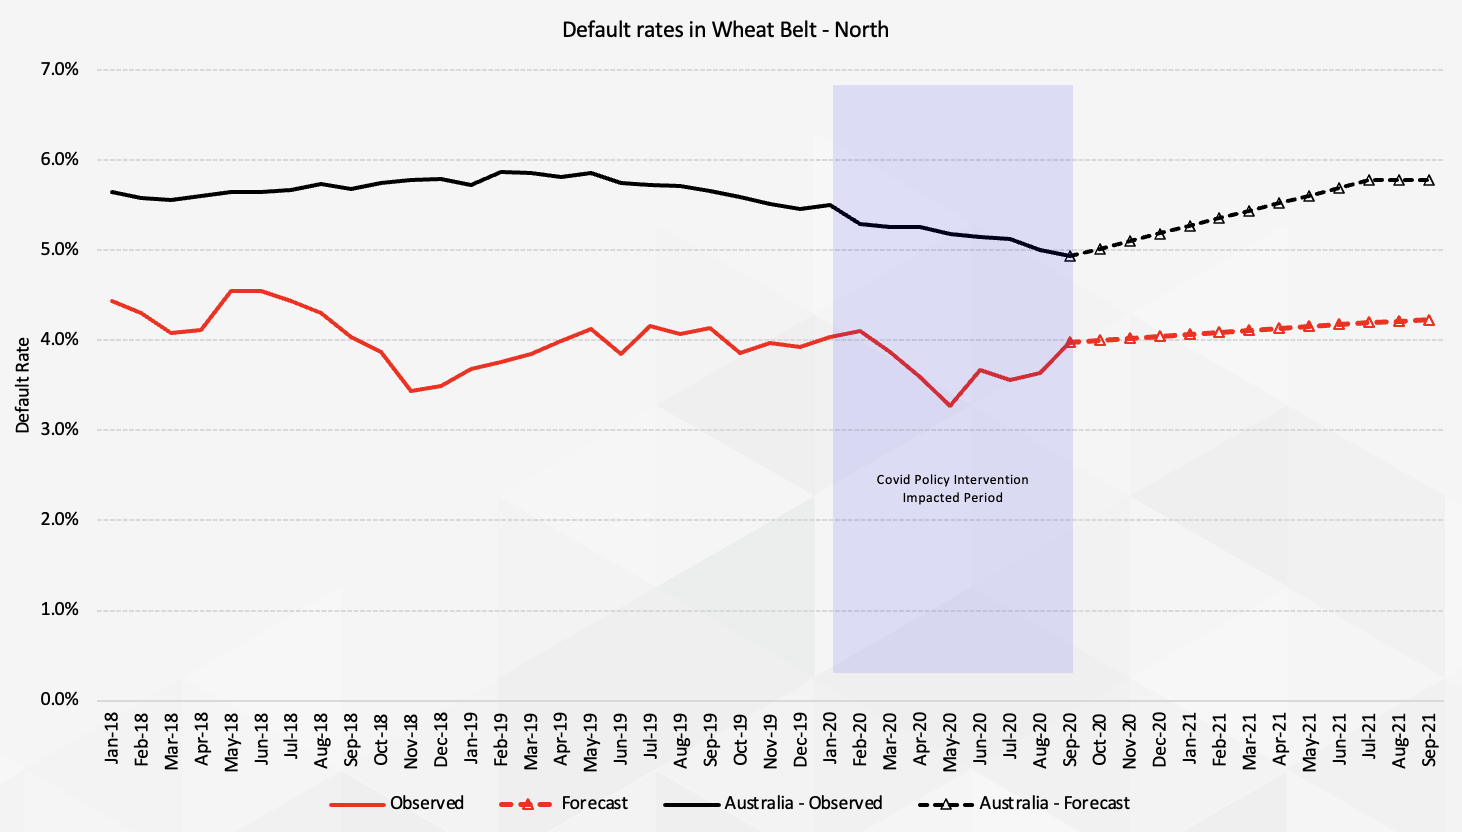
The chart below shows the 12 month rolling average liquidation rate for Wheat Belt.
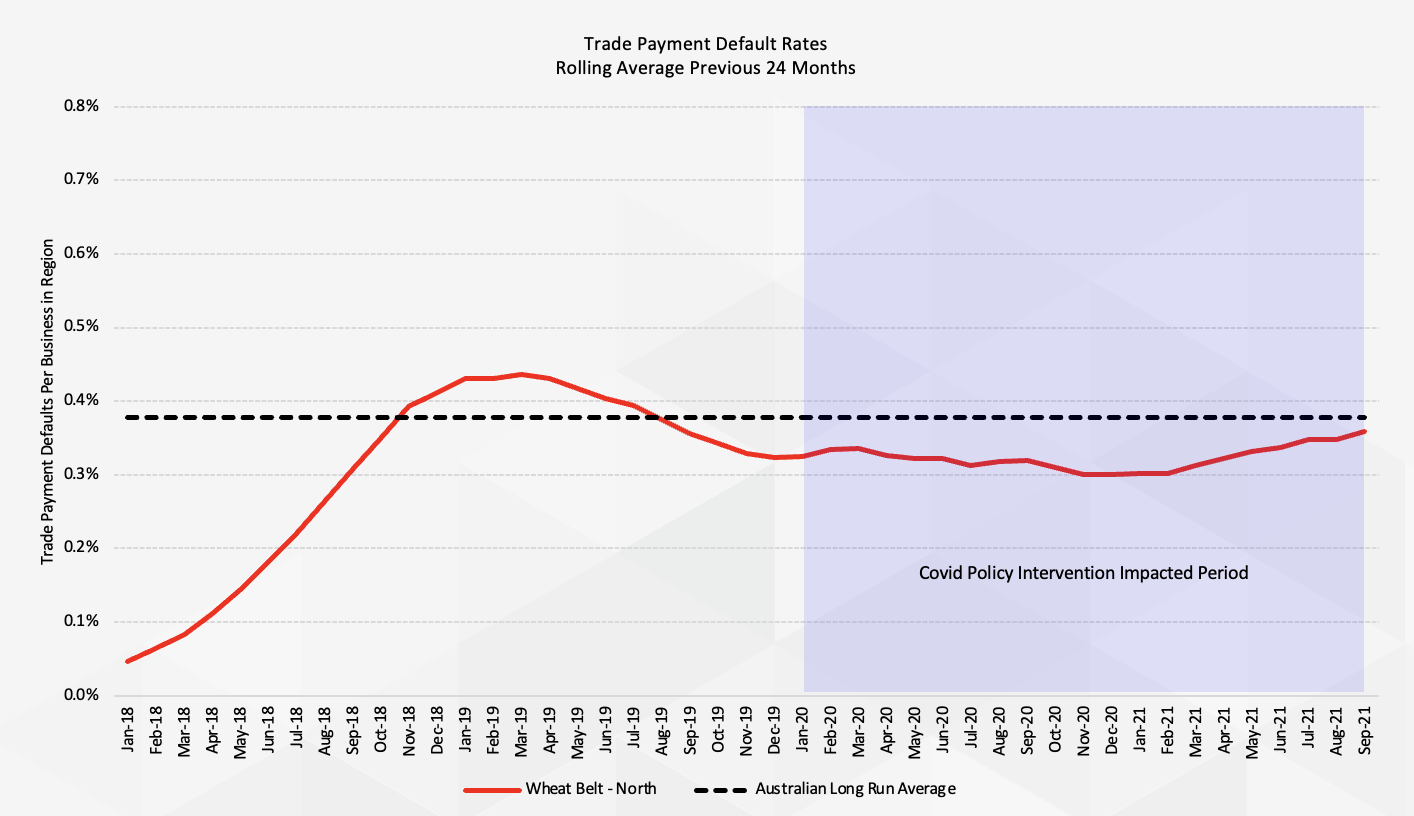
The chart below shows the rolling 24-month average business-to-business trade payment default rate for Wheat Belt.
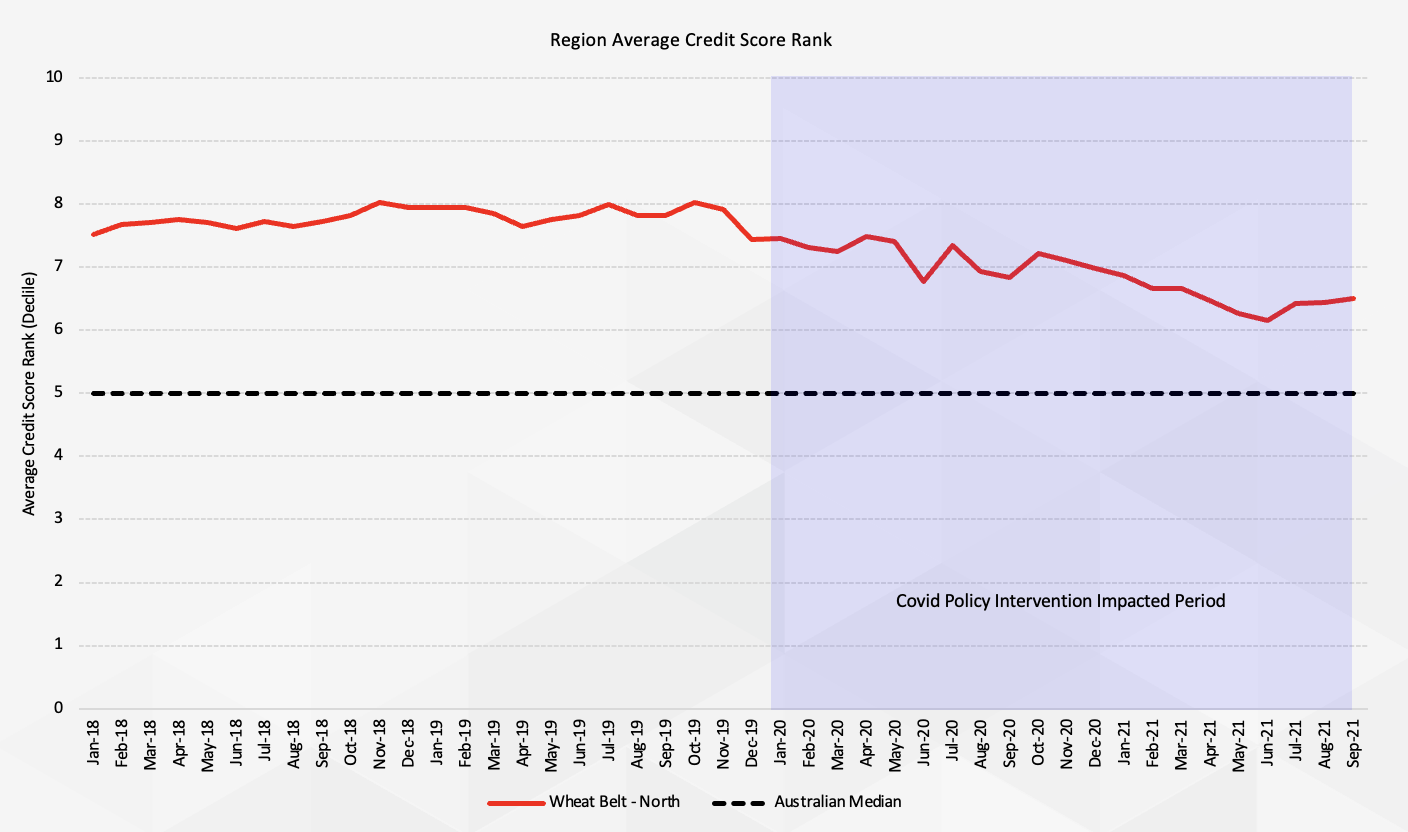
The chart below shows the regional average credit score ranking for Wheat Belt.
The chart below shows Wheat Belt structural economic indicator ranking relative to the rest of Australia for key economic factors contributing to the business risk index.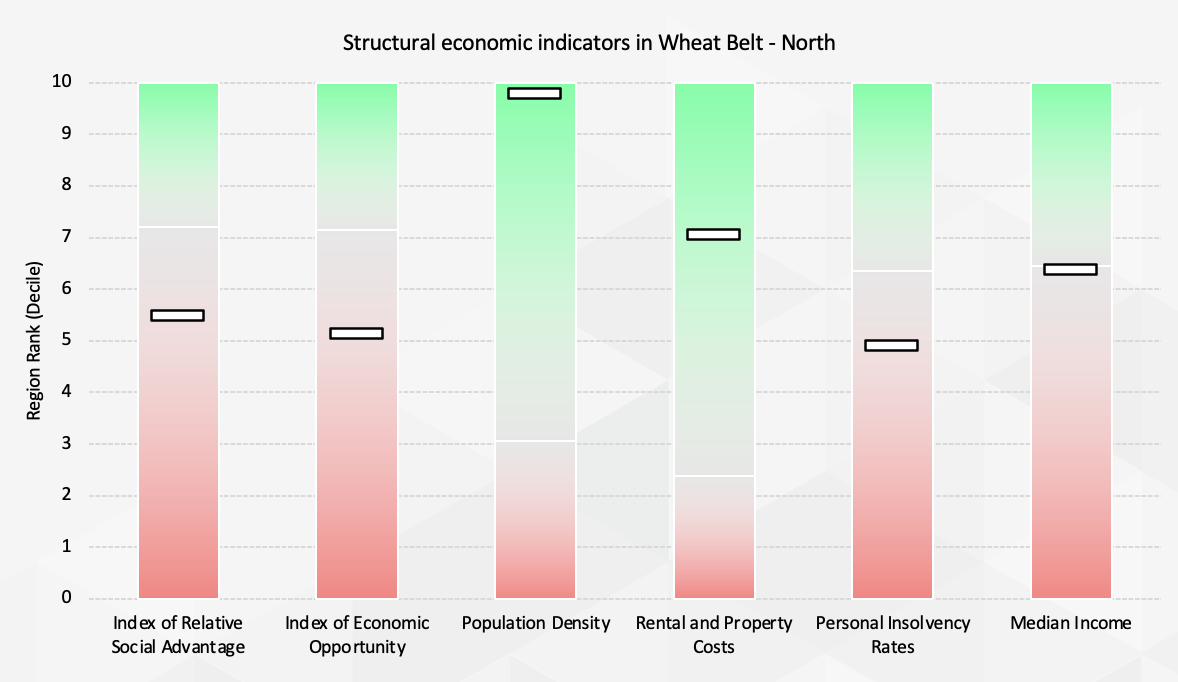
Register for Business Risk Index updates
Register to receive a monthly email containing the latest Business Risk Index data and expert analysis.
