ATO tax debt signals elevated insolvency risk
The number of businesses with ATO tax debts exceeding $100,000 has increased in recent months, with the past four months among the highest readings since the resumption of ATO collections activity following the COVID pandemic.
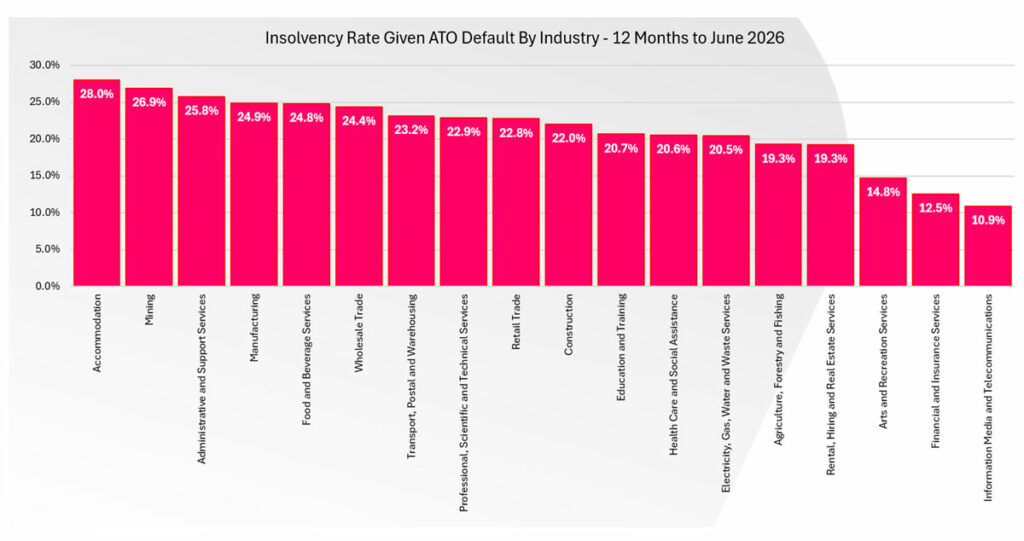
At the same time, more businesses are being removed from the tax default register, likely reflecting repayment arrangements with the ATO, which partially moderates the forward risk signal. However, the underlying relationship remains clear: Businesses with tax debts over $100,000 experienced insolvency rates above 20% over the past 12 months in most industries.
FY26 insolvency review: improvement, but uneven
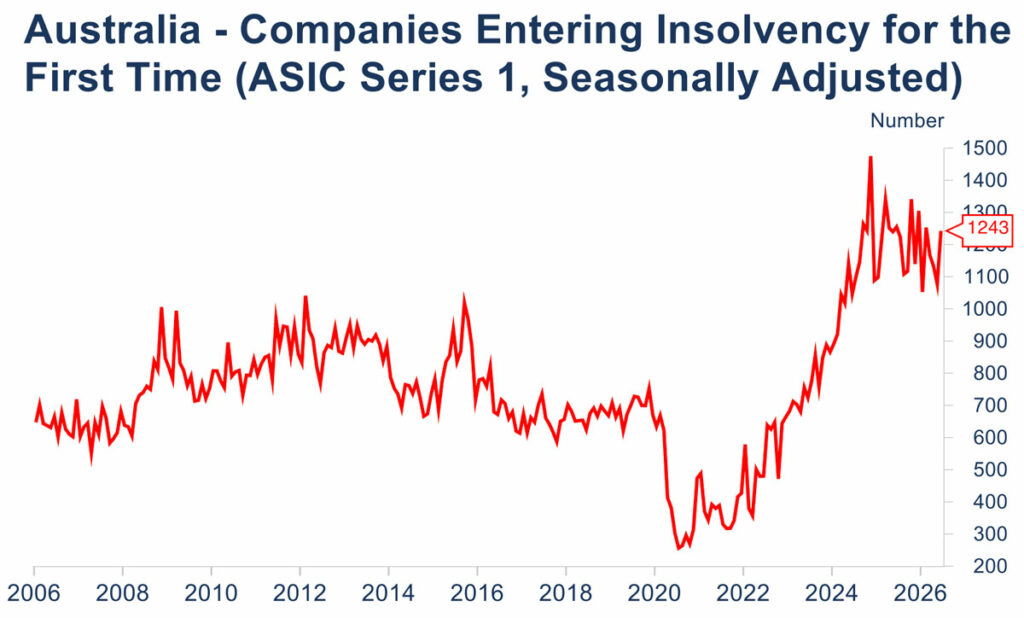
ASIC data for 2025–26 shows a decline in overall insolvency numbers compared to the previous financial year, with insolvencies totalling around 0.5% of all operating businesses as at 30 June. This improvement reflects the lagged benefits of earlier policy support, including income tax cuts and a period of interest rate stabilisation, which provided some relief to business cash flow and balance sheets.
However, this headline improvement masks a more uneven underlying picture. While insolvencies declined across most sectors, Accommodation & Food Services (-15%) and Construction (-4%) continue to carry structurally higher levels of risk. In Hospitality in particular, insolvency rates remain around three times the national average, reflecting the sector’s ongoing exposure to thin margins, high labour costs and sensitivity to changes in consumer spending. Even with improved conditions, many businesses in this sector are still operating with limited buffers.
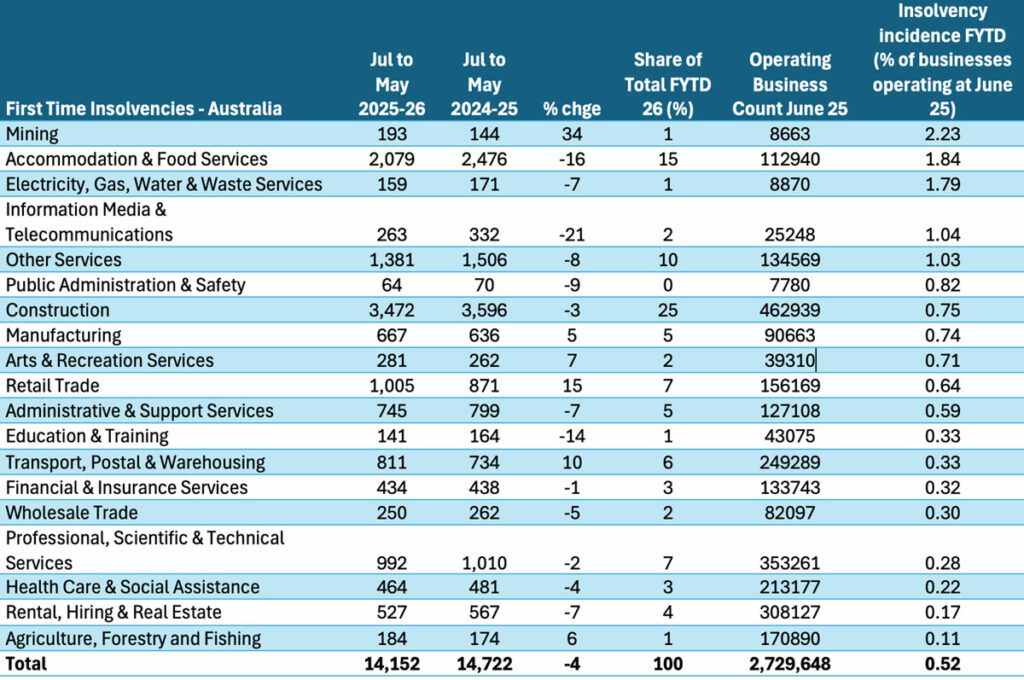
The improvement in Construction also appears fragile. While insolvencies declined, the sector continues to face elevated input costs, labour shortages and project pipeline uncertainty. The decline likely reflects temporary relief from earlier cost pressures rather than a full recovery in underlying conditions.
In contrast, several sectors recorded significant increases in insolvencies, pointing to emerging pressure points in the economy. Mining saw the largest increase (35%), which likely reflects volatility in smaller operators and exploration activities rather than the performance of large, established firms. Retail Trade insolvencies rose by 18%, reinforcing the ongoing structural challenges facing parts of the sector, including margin compression, shifting consumer behaviour and competition from online and low-cost operators.
Transport, Postal & Warehousing recorded a 14% increase in insolvencies, highlighting the impact of rising fuel costs, interest rates and competitive intensity - particularly in road transport. These businesses are highly sensitive to cost increases and often have limited ability to pass these on, making them vulnerable to even modest changes in operating conditions.
Arts & Recreation Services also saw an 8% increase in insolvencies, reflecting softer discretionary spending and reduced consumer demand in non-essential categories. This aligns with broader trends showing households becoming more selective in their spending as cost-of-living pressures persist.
Divergence within sectors intensifies
Diverging trends within industries are becoming more pronounced, highlighting that sector-level analysis is increasingly insufficient to understand where risk is building. Instead, financial stress is emerging at a sub-sector level, driven by differences in cost exposure, competitive dynamics and demand conditions.
In Retail Trade, insolvencies have risen in Department Stores, Non-store Retailing and Pharmaceuticals, pointing to pressure in segments exposed to intense competition, margin compression and changing consumer behaviour.
In contrast, insolvencies have declined in Recreational Goods and Motor Vehicle Parts & Tyre Retailing, suggesting more resilient demand in categories linked to maintenance spending and discretionary items with more stable pricing power. This split reflects a broader shift in consumer spending patterns, where essential or maintenance-related purchases are holding up better than more structurally challenged retail formats.
A similar divergence is evident in Manufacturing. Insolvencies have increased in Structural Metal Products, while Basic Ferrous Metal Products Manufacturing continues to record insolvency rates at around four times the national average.
This suggests ongoing structural pressure in parts of the manufacturing sector, particularly those exposed to global competition and input cost volatility. In these areas, higher energy and material costs are combining with competitive pricing pressures, limiting the ability of businesses to maintain margins.
Payment defaults remain elevated
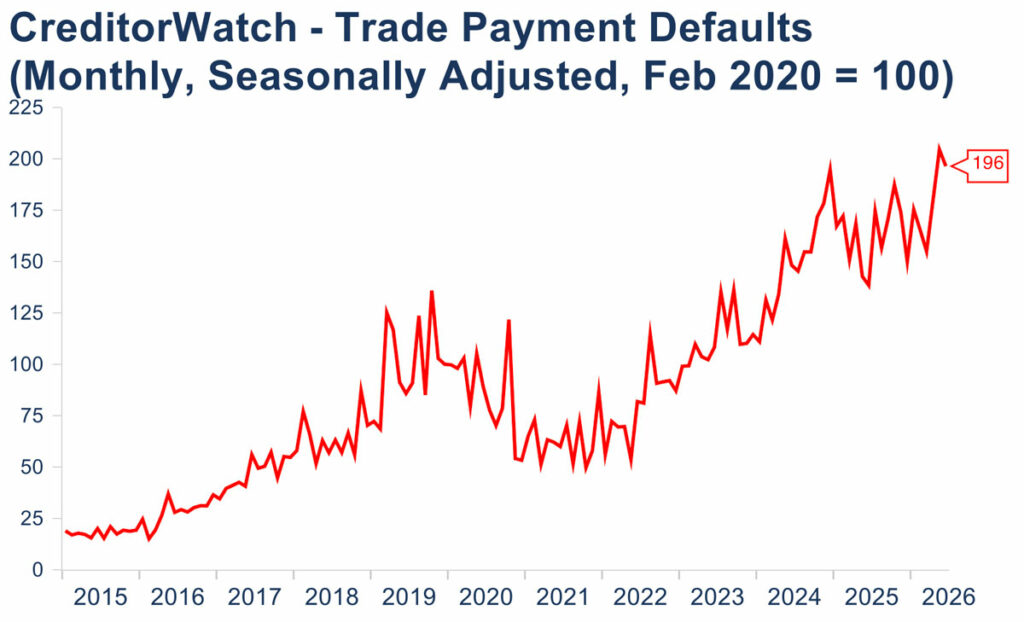
Trade payment defaults remain one of the strongest forward indicators of insolvency risk. Even a single payment default registered against a company increases the likelihood of insolvency to more than ten times the national average over the following 12 months. Multiple defaults further increase this risk.
After rising sharply in May, trade payment defaults remained elevated in June, suggesting businesses are beginning to feel the combined effects of higher interest rates and fuel prices.
Economic pressures driving a multi-speed economy
Business conditions are being shaped by several overlapping forces that are affecting sectors very differently. Rather than a uniform slowdown, these pressures are creating a clear divide between businesses benefiting from structural tailwinds and those facing sustained cost pressure.
Higher interest rates continue to lift the cost of servicing debt, reducing cash flow flexibility and limiting businesses’ ability to absorb shocks such as late payments. At the same time, rising fuel prices are acting as a broad-based cost increase, particularly for transport, retail and manufacturing. For these sectors, margins are being squeezed as costs rise while pricing power remains limited, especially in competitive or discretionary markets.
Geopolitical tensions are adding further pressure by disrupting energy markets and supply chains. This is increasing both costs and uncertainty for businesses reliant on transport or energy-intensive production. In practical terms, this is leading to longer delivery times, more volatile input prices and greater working capital strain, particularly for smaller businesses with less capacity to absorb shocks.
At the same time, the global build-out of AI infrastructure is creating a powerful but uneven economic force. Strong demand for inputs such as semiconductors, energy and metals is benefiting sectors like mining and parts of construction, particularly data centre-related activity. However, this demand is also contributing to broader inflationary pressure, reinforcing higher input costs and supporting interest rates staying elevated. This is widening the gap between sectors linked to AI investment and those exposed to rising costs.
Changes announced in the May Budget are adding another layer of complexity. While some measures are targeted at housing, broader changes to trust taxation and capital gains tax arrangements are influencing business structures and investment decisions more widely. This is contributing to increased uncertainty and, in some cases, delaying investment, particularly against a backdrop of already weaker housing market conditions.
Geo-risk divides: Adelaide leads while Western Sydney remains ground zero
Australia's geographic business risk map is sharply divided. Adelaide's affluent inner-metro belt leads the nation, with Norwood–Payneham–St Peters (80.4) and Unley (80.1) topping rankings on the Business Risk Index for areas with at least 5,000 businesses. They were followed by regional and lifestyle areas like Ballarat, Pittwater, Ku-ring-gai, Yarra Ranges and Toowoomba.
In stark contrast, seven of the 10 highest-risk suburbs cluster in Western Sydney - led by Bringelly–Green Valley (0.0) and Merrylands–Guildford (0.3) with default rates near 7.9% - alongside outer Melbourne's Tullamarine–Broadmeadows and Melton–Bacchus Marsh, plus QLD's Ormeau–Oxenford.
Capital-city CBDs also lag: Sydney Inner City (29.5), Brisbane Inner (33.4) and Melbourne City (37.0) all sit in the ‘increased risk’ band. Year-on-year, Pittwater (+11.1) and Leichhardt (+9.0) rebounded the strongest, while Banyule (-11.4), Knox (-9.3) and North Sydney–Mosman (-9.3) deteriorated most. Elevated interest rates, fuel prices and award-wage pressures are squeezing mortgage-belt suburbs while affluent, established regions with older populations absorb shocks better - signalling an uneven recovery with clear policy implications.
Outlook: early warning signs building
What is the insolvency rate for Australian businesses with ATO tax debts over $100,000?
Businesses with Australian Taxation Office (ATO) tax debts exceeding $100,000 recorded an average insolvency rate of 21.9% over the 12 months to June 2026 - 31 times the national average of 0.7%, according to CreditorWatch's June 2026 Business Risk Index. As at 30 June 2026, 35,361 businesses carried tax debts above the $100,000 disclosure threshold, and 53.8% (19,024) of them were sole traders, who typically run on tighter cash margins and smaller buffers.
Did business insolvencies rise or fall in Australia during FY26?
Overall insolvencies fell 3.9% in FY26 compared with FY25, equating to around 0.5% of all operating businesses as at 30 June 2026. The decline was supported by 2024 income tax cuts and 2025 interest rate reductions, and was strongest in high-risk sectors like Construction (-4%) and Accommodation & Food Services (-15%). However, the improvement was uneven: insolvencies rose in Mining (+35%), Retail Trade (+18%), Transport, Postal & Warehousing (+14%) and Arts & Recreation Services (+8%).
How much does a single trade payment default increase a business's insolvency risk?
A single trade payment default registered against a company increases its likelihood of insolvency to more than 10 times the national average over the following 12 months, and multiple defaults raise the risk further. CreditorWatch identifies trade payment defaults as one of the strongest forward indicators of business failure. After spiking in May 2026, defaults remained elevated in June 2026, reflecting the combined pressure of higher interest rates and fuel prices.