SYDNEY, Wednesday 10 November – The October 2021 CreditorWatch Business Risk Index (BRI) has revealed a tale of two regions for the Victorian economy. Three of the top five regions around Australia with the lowest risk of default are in regional Victoria. This is a stunning result given much of the state has been in lockdown over the previous two years.
However, metropolitan Melbourne has the worst outlook among the state capitals following extended lockdowns. The biggest deterioration is in the Monash and Manningham local government areas of outer Melbourne.
This is the second month the CreditorWatch Business Risk Index has been published. It’s a measure that predicts the likelihood of businesses defaulting over the next 12 months across more than 300 regions around the country. The index utilises CreditorWatch’s proprietary data, combined with data the Australian Securities and Investments (ASIC) collects on more than a million local private businesses, among other variables.
The Business Risk Index for October shows COVID closures are still having an impact on economic activity. The number of defaults fell by 2.4 per cent in the month, falling by 11 per cent for the three months to October.
The nationality probability of default for October stands at 5.78%, relatively flat compared to September (5.77%).
“The data we’re seeing at the moment is atypical, given the banks’ and the ATO’s lenient attitude to debt collection through the pandemic,” says CreditorWatch CEO Patrick Coghlan.
“Eventually, this situation will normalise, and defaults, court actions and administrations will return to more typical pre-COVID levels,” he adds.
Key Business Risk Index insights for October:
- Three of the top five regions in Australia with the lowest risk of default are in regional Victoria – surprising given the heavy and enduring lockdowns the state has been under
- Expect insolvencies and credit defaults to rise across the country in the short term
- Trade turnover was weak again in October, however, we still expect to see significant growth over the coming quarter
- The Gold Coast and Western Sydney remain the highest risk regions in the country
- Regional areas are outperforming urban and city centres. We suspect this is due to industry related factors including strong performance in the following sectors of the economy that are concentrated in high-performing regional areas:
- Agribusiness
- Mining
- Manufacturing
- Renewable energy
The top five regions at least risk of default are:
- Murray River – Swan Hill VIC: 3.69% are at risk of default
- Limestone Coast SA: 3.72% are at risk of default
- Moree – Narrabri NSW: 3.74% are at risk of default
- Glenelg – Southern Grampians VIC: 3.80% are at risk of default
- Grampians VIC: 3.85% are at risk of default
Lower rental and property costs, and below average default rates among businesses in these regions, have contributed to the result. It’s interesting to see other factors with a smaller weighting in the index such as the Australian Bureau of Statistics’ (ABS) Index of Relative Social Advantage and the Index of Economic Opportunity, and median income are lower than average, as is population density.
Top five areas at most risk of default are:
- Merrylands – Guildford NSW: 7.76%
- Gold Coast – North QLD: 7.73%
- Bringelly – Green Valley NSW: 7.66%
- Canterbury NSW: 7.57%
- Coolangatta QLD: 7.45%
This month, Merrylands – Guildford has scored a below-average result for all factors. The CreditorWatch Business Risk Index considers aside from personal insolvency rates…
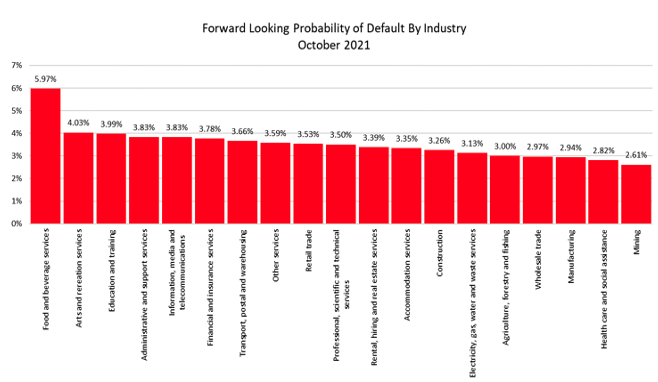
Probability of default by industry
Highest
- Food and beverage services: 5.97%
- Arts and recreation services: 4.03%
- Education and training: 3.99%
The accommodation, food and beverage industry has been severely impacted by government-enforced COVID-closures. This sector should start to recover now lockdowns across major capital cities have ended.
Lowest
- Mining: 2.61%
- Health Care and Social Assistance: 2.82%
- Manufacturing: 2.94%
Defaults are lowest in the mining sector given high commodity prices are supporting this sector.
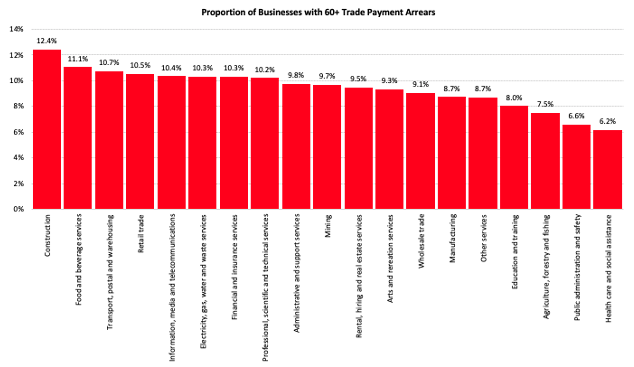
Payment arrears by industry
Highest
- Construction: 12.6%
- Food and beverage services: 11.1%
- Transport, postal and warehousing: 10.7%
The construction industry has been hard hit by lockdowns, especially in NSW and Victoria and the industry is still recovering.
Lowest
- Health Care and Social Assistance: 6.2%
- Public Administration and Safety: 6.8%
- Agriculture, Forestry and Fishing: 7.5%
Health care is performing well as activity in this sector begins to normalise after parts of it were re-directed to focus on providing services to COVID patients.
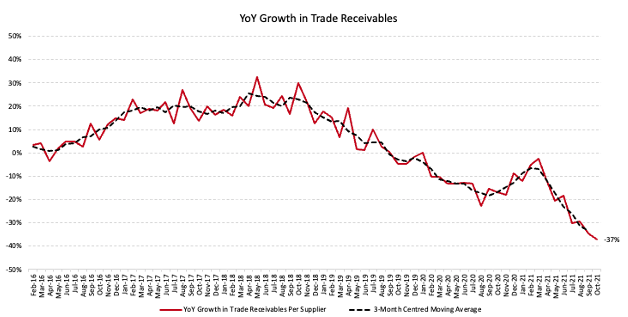
Trade receivables continue to decline
Trade receivables fell again in October, to now sit 37 per cent lower than at October 2020.
Defaults
Monthly data shows defaults fell by 2.4 per cent from September to October. Defaults dropped by 11 per cent over the three months to the October 2021 quarter and are down by 43 per cent year-on-year.
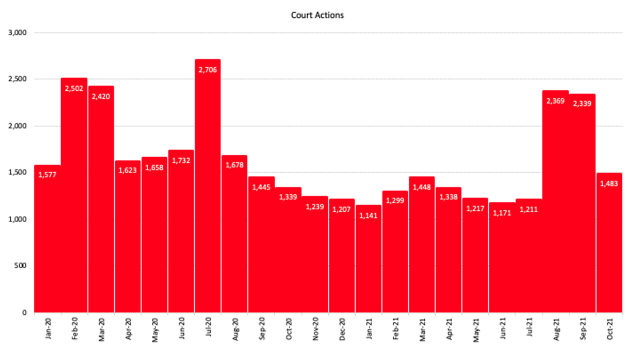
Court actions
Court cases, which were understandably suppressed during lockdowns, were down by 35 per cent for October, although they were up by 16 per cent in the three months to October 2021, albeit from a very low base. We expect court actions to increase in the near term as the economy opens up and business conditions return to normal.
External administrations
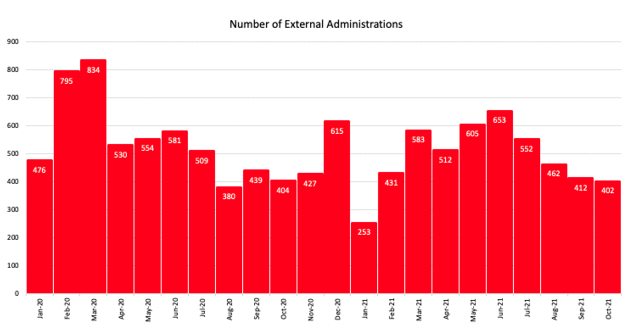
The number of external administrations has been on a downward slide since a peak in June 2021. Administrations fell by four per cent in October compared to a year earlier. This drop appears counterintuitive given the tough trading conditions most businesses faced through 2020 as a result of lockdowns. The reason the number of external administrations has not grown through this period is due to COVID-related leniency from financial institutions and the Australian Taxation Office (ATO) and the major banks. On an annual and quarterly basis, administrations increased by two per cent over the October quarter. We are expecting to see an increase in the short term as the economy opens up and we return to business as usual.
If we look back to the pre-COVID period, the number of external administrations averaged 845 in 2019. That figure dropped to 499 in the 2020/21 financial year. The average over the 10 months to October 2021 was 497. Consequently, if you compare the 10 months of 2021 to the full calendar year of 2019, external administrations are down by 41 per cent.
Credit enquiries
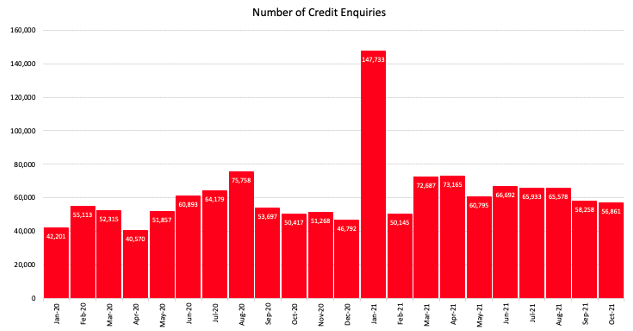
The number of credit enquiries remained subdued in October 2021. Following spikes in March and July, inquiries fell by 14 per cent over the three months to the October quarter. As a comparison enquiries fell by just one per cent for the three months to October 2020.
Business turnover
Business turnover plummeted in October, down by 37 per cent on an annual basis, following a commensurate drop of 34 per cent in September. This is the largest contraction experienced since the pandemic began. Business turnover started falling on an annual basis back in October 2019, reinforcing what CreditorWatch has highlighted before – the Australian economy entered this pandemic in relatively poor shape.
Outlook
There is a mixture of euphoria and uncertainty surrounding Australia’s post-lockdown world. The data shows some industries and regions are struggling from COVID’s effects. Other regions and industries are thriving.
ABOUT THE BUSINESS RISK INDEX
The Business Risk Index is a predictive economic indicator to help guide businesses when making future growth plans and inform public policy. It is a new credit rating that ranks more than 300 Australian geographies by relative insolvency risk, providing unique insights into the health of Australian businesses by region.
Each region is ranked from best to worst in terms of the potential for businesses in it to become insolvent. The index can also measure the potential for insolvency risk at a national, state and individual business level.
Regions are ranked on a scale from zero to 100, where 100 represents the best credit quality regions, that is, the lowest risk of insolvency, and zero represents the weakest credit quality regions, that is, the highest insolvency risk.
The index is calibrated by data from approximately 1.1 million ASIC-registered, credit-active businesses. It combines these insights with CreditorWatch’s proprietary data, previously published as the monthly Business Risk Review.
Subscribe to the Business Risk Index to be the first to receive our monthly updates.
Mitchy Koper
GM Communications and Marketing, CreditorWatch
mitchy.koper@creditorwatch.com.au
0417 771 778

