SYDNEY, Wednesday 8 December – The November 2021 CreditorWatch Business Risk Index (BRI) has revealed that business activity around Australia is currently weaker than expected, indicating that the return to pre-COVID levels is now likely to take longer than many pundits had anticipated.
The data also showed a jump in defaults, external administrations, payment arrears and court actions from October to November. However, credit enquiries rose 17 per cent, indicating that business confidence is improving.
Key Business Risk Index insights for November:
- Economy fails to bounce back as strongly as expected post-lockdowns.
- Trade activity continues to fall.
- Defaults, external administrations, payment arrears and court actions have jumped.
- Credit enquiries jumped 16.6%, indicating that business confidence is returning.
- States that shut their borders but kept their internal economies going, such as WA and QLD are seeing their metro areas bounce back fastest.
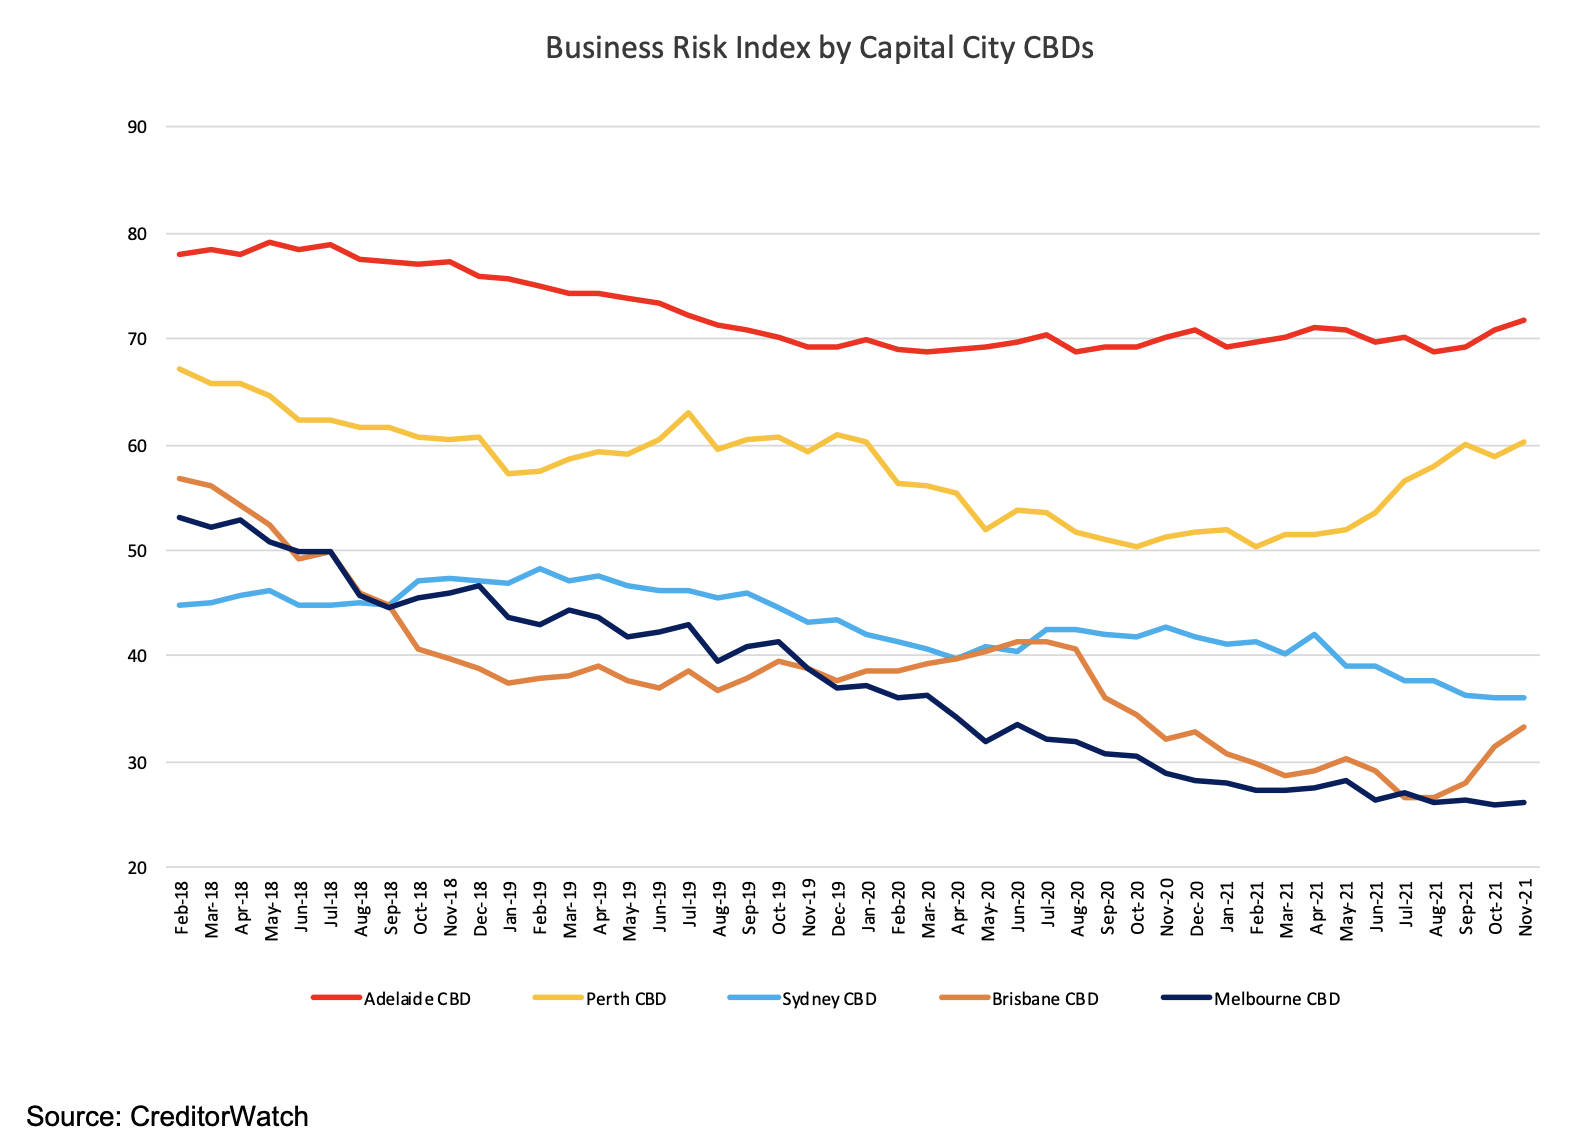
- Melbourne and Sydney CBDs remain the worst performing capital city centres with probability of default at historic high-levels due to depressed trade activity continuing post-lockdown.
- Credit behaviour and performance scores are improving among the hardest-hit Western Sydney suburbs including Bankstown, Burwood, Ashfield and Strathfield.
The nationality probability of default for November was flat – 5.79 per cent, compared to 5.80 per cent for October. The probability of default for Sydney and Melbourne CBDs is at record levels. The top five areas at most risk of default are:
- Merrylands – Guildford NSW: 7.73%
- Gold Coast – North QLD: 7.73%
- Bringelly – Green Valley NSW: 7.69%
- Canterbury NSW: 7.56%
- Coolangatta QLD: 7.50%
The number of defaults spiked higher by 53 per cent in November. Over the three months to November 2021 defaults were still down by 14.7 per cent.
CreditorWatch’s data showed that while business activity remains stubbornly depressed, it is the states that closed their borders but allowed their economic engines, capital cities and industries, to continue to operate relatively lockdown-free that are now seeing the strongest bounce backs in metro areas. Meanwhile, businesses in the two cities that endured the longest lockdowns, Melbourne and Sydney, are experiencing record high probabilities of default.
“The increase in credit enquiries in November is an encouraging forward indicator of business confidence, however, there’s a long way go before business activity is at pre-COVID levels. Worryingly, trade receivables continued to decline last month, and we also saw significant increases in defaults and administrations. Businesses in the Sydney and Melbourne CBDs, in particular, are at historically high probabilities of default,” says CreditorWatch CEO Patrick Coghlan.
The CreditorWatch Business Risk Index predicts the likelihood of businesses defaulting over the next 12 months across more than 300 regions around the country. The index utilises CreditorWatch’s proprietary data, combined with data the Australian Securities and Investments (ASIC) collects on more than a million local private businesses, among other variables.
Business activity remains stubbornly depressed post lockdown.
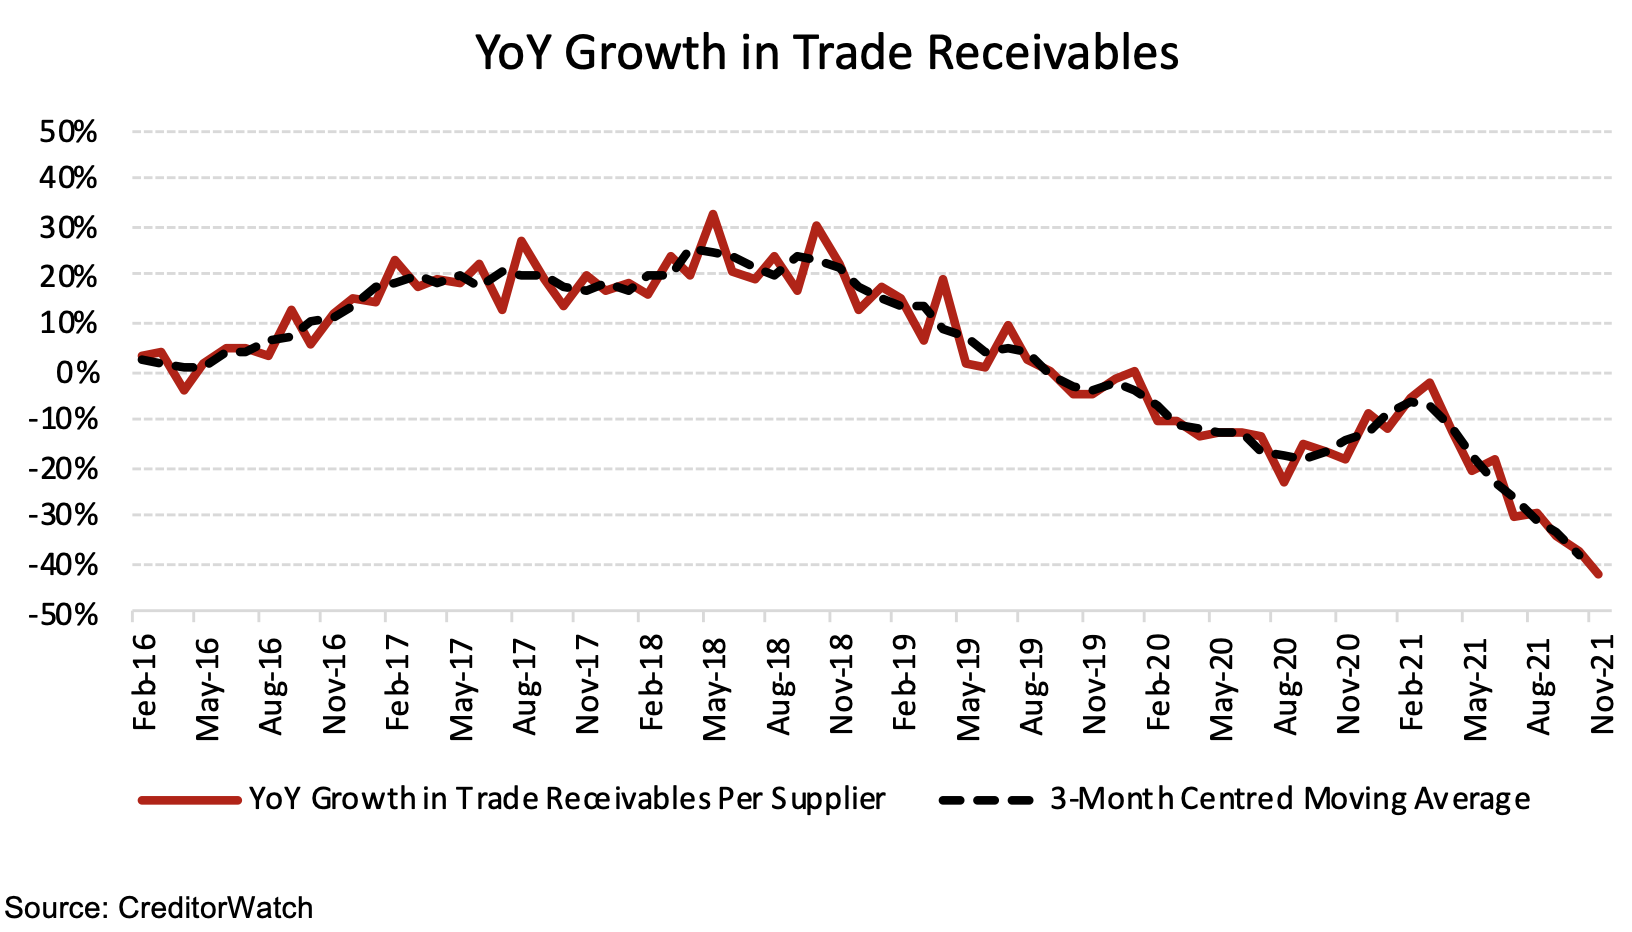
Despite the recent end to lockdowns in Melbourne and Sydney and Black Friday sales, small business trade activity remains weak. Many were hoping the first post-lockdown month would see a bump in business activity, however CreditorWatch’s data paints a picture of a long and slow recovery.
November 2021 small business trade receivables were down 42.2% compared to November last year. Despite greater freedoms for consumers and businesses, ongoing supply chain constraints, labour shortages, cost pressures and uncertainty around emerging COVID variants are contributing to these weaker-than-expected results.
Perth and Brisbane CBDs significantly out-performing capital city peers
Western Australia and Queensland have had the strictest closed border policies throughout the pandemic, coupled with the least restrictive lockdown policies due to lower local case numbers.
This isolationist policy has had mixed results across business sectors within those states over the past two years, however we are clearly seeing Perth and Brisbane as stand out performers over the last quarter.
In relative terms, Perth city has been the biggest mover up the BRI ranks among capital city CBDs over the past 12 months, in line with a strong performance across Western Australia as a whole, fueled by booming agribusiness and mining sectors.
Queensland is more of a mixed-bag with clear winners and losers.
As a state, Queensland has been the weakest performer over the past year, primarily driven by border closure impacts on the Gold Coast and other key tourism regions, offset to some extent by a strong performance by the agribusiness sector. However, Brisbane city has seen the largest improvement in insolvency risk and credit rating of any major city centre in Australia.
Probability of default by region
The top five regions at least risk of default are:
- Murray River – Swan Hill VIC: 3.69%
- Limestone Coast SA: 3.73%
- Grampians VIC: 3.75%
- Moree – Narrabri NSW: 3.76%
- Glenelg – Southern Grampians VIC: 3.80%
Why Murray River – Swan Hill?
This region scores better than average against other regions in Australia for rental and property costs, Riskscore, observed default rate and the CreditorWatch Default Rate. These factors have the largest weights and therefore influence in determining the risk of default. Other factors with smaller weightings such as the Index of Relative Social Advantage, Index of Economic Opportunity and Median Income are worse than average, while the Population Density is much better than average and together have less of an overall impact.
Top five areas at most risk of default are:
- Merrylands – Guildford NSW: 7.73%
- Gold Coast – North QLD: 7.73%
- Bringelly – Green Valley NSW: 7.69%
- Canterbury NSW: 7.56%
- Coolangatta QLD: 7.50%
Why Merrylands – Guildford?
All model factors for this region are below the Australian average except personal insolvency rate. The region was far worse than average for Riskscore, observed default rate and CreditorWatch Default Rate. This region was one of the hardest Western Sydney areas hit by extended lockdowns.
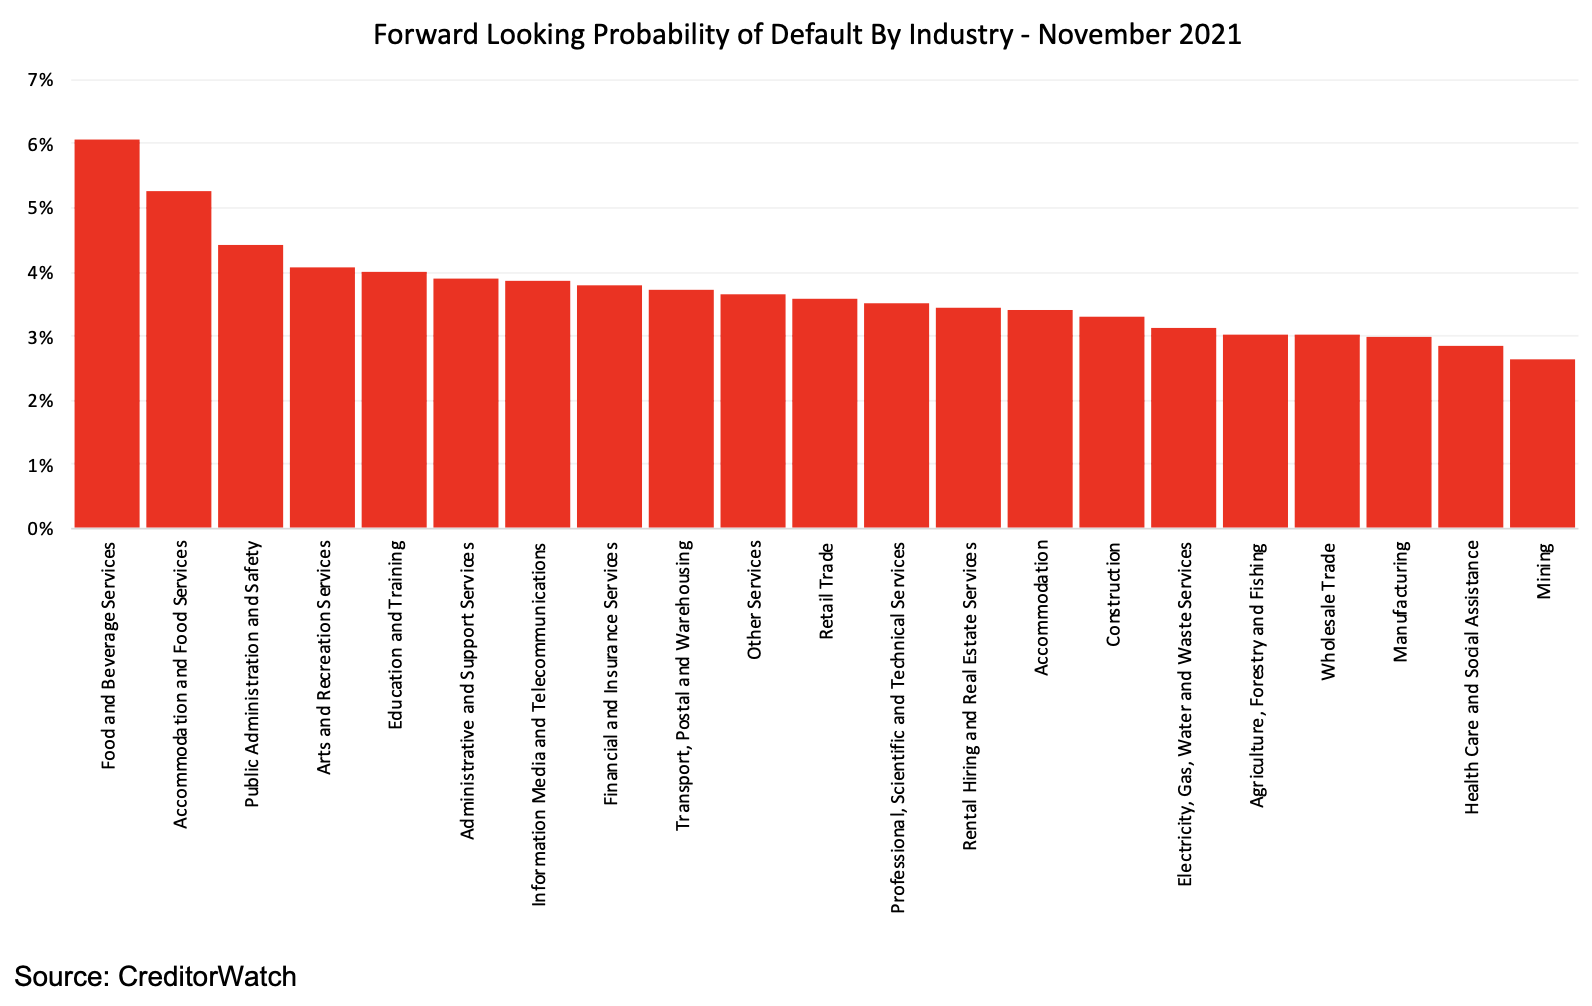
Probability of default by industry
Highest
- Accommodation and Food Services: 5.25%
- Arts and recreation services: 4.08%
- Education and training: 4.01%
We are still seeing front-line service industries struggling to recover post lockdowns. They can’t just flick on a light switch and get back to previous operations. Fortunes will progressively turn around and the December Christmas period should allow many businesses to up the ante. The education and training sector desperately needs overseas students but isn’t getting them. That is having an impact.
Lowest
- Mining: 2.63%
- Health Care and Social Assistance: 2.84%
- Manufacturing: 3.00%
The mining industry is benefiting from strong commodity prices and health will be a growth industry as lockdown restrictions recede. Meanwhile, agriculture is reaping the rewards of bumper harvests and prices, but only in areas where they were fortunate enough to complete most of the harvest before the rains and floods arrived. Much of northern New South Wales, for example, achieved that.
Manufacturing in Australia is finding its legs after learning from the challenges of the 2020 lockdowns. In addition, there are positive stories in places like the M7 corridor in Sydney and parts of outer Melbourne as economies open up to foot traffic as well as enjoying continued online demand.
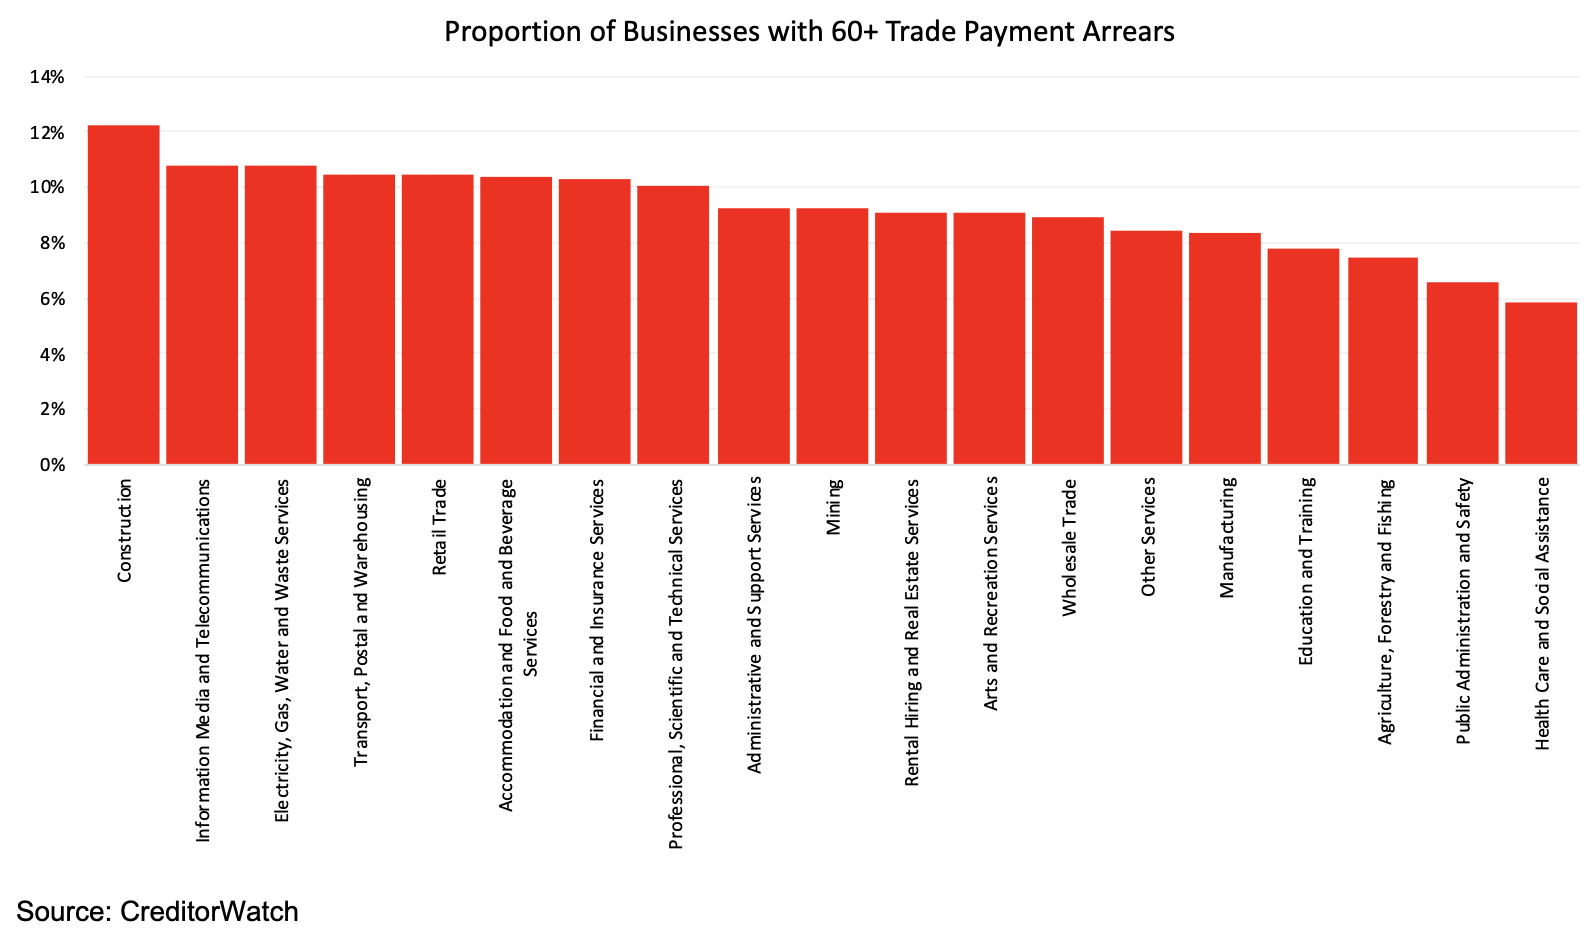
Payment arrears by industry
Highest
- Construction: 12.6%
- Food and beverage services: 11.1%
- Transport, postal and warehousing: 10.7%
These statistics tell a clear tale of what is occurring in the broader Australian economy. Construction was hard hit by mandatory industry shutdowns and now faces severe supply constraints in items such as timber. Food and beverage services suffered with so few businesses being fully open during lockdowns.
As people return to venues, this industry will thrive again, but there were enormous overheads to cover through the middle of 2021 and over the last nearly two years in general. Businesses involved in transportation are being hit by strike action and global supply disruptions. A boom in online shopping is one thing, but these industries also need demand from bricks and mortar businesses, which they have not had for several months.
Lowest
- Health Care and Social Assistance: 5.8%
- Agriculture, Forestry and Fishing: 7.5%
- Education and Training: 7.8%
Health Care and Social Assistance is heavily state funded (and therefore implicitly ‘guaranteed’) and is still greatly influenced by COVID. Almost the entire agriculture industry is booming right now with some record harvests, strong demand and therefore better than usual income and cashflow. Education and Training benefits from government funding although conversely, it does traditionally display high rates of default.
Defaults
The number of defaults spiked higher by 53 per cent in November, albeit that is not a seasonally adjusted number. It is a preliminary sign that Small and Medium-sized Enterprises (SME’s) are engaging with a post-lockdown period which isn’t entirely comfortable. It will be important to track how the number of defaults fares in approaching months.
Defaults are like other key contemporary CreditorWatch indicators such as external administrations and the number of court actions. While not seasonally adjusted, spikes of 15 per cent and 85 per cent in November, respectively, for these two measures simply can’t just be ignored.
Defaults are like other key contemporary CreditorWatch indicators such as external administrations and the number of court actions. While not seasonally adjusted, spikes of 15 per cent and 85 per cent in November, respectively, can’t just be ignored.
We may be on the cusp of SMEs facing the commercial reality of a post lockdown environment.
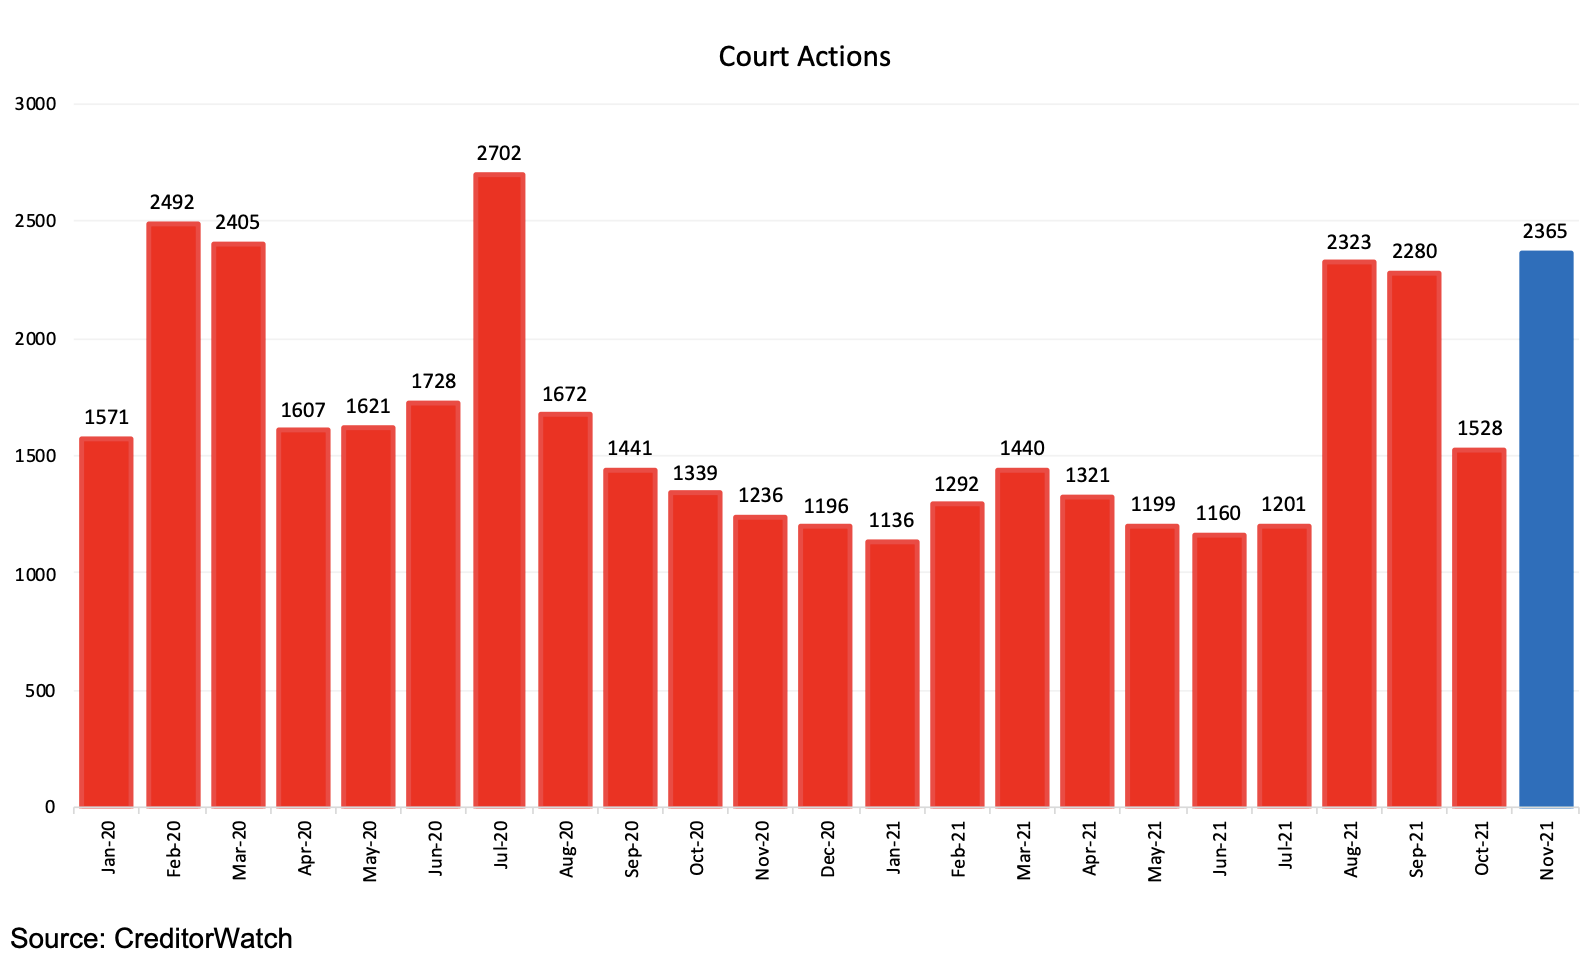
Court actions
As noted above, the number of court actions spiked by 85 per cent in November, in original terms. Over the November 2021 ‘quarter’ court actions increased by 21 per cent to be up by 27 per cent compared to the same period last year. The number of court actions is at its highest since March 2020 and possibly signals a path back to normalised proceedings.
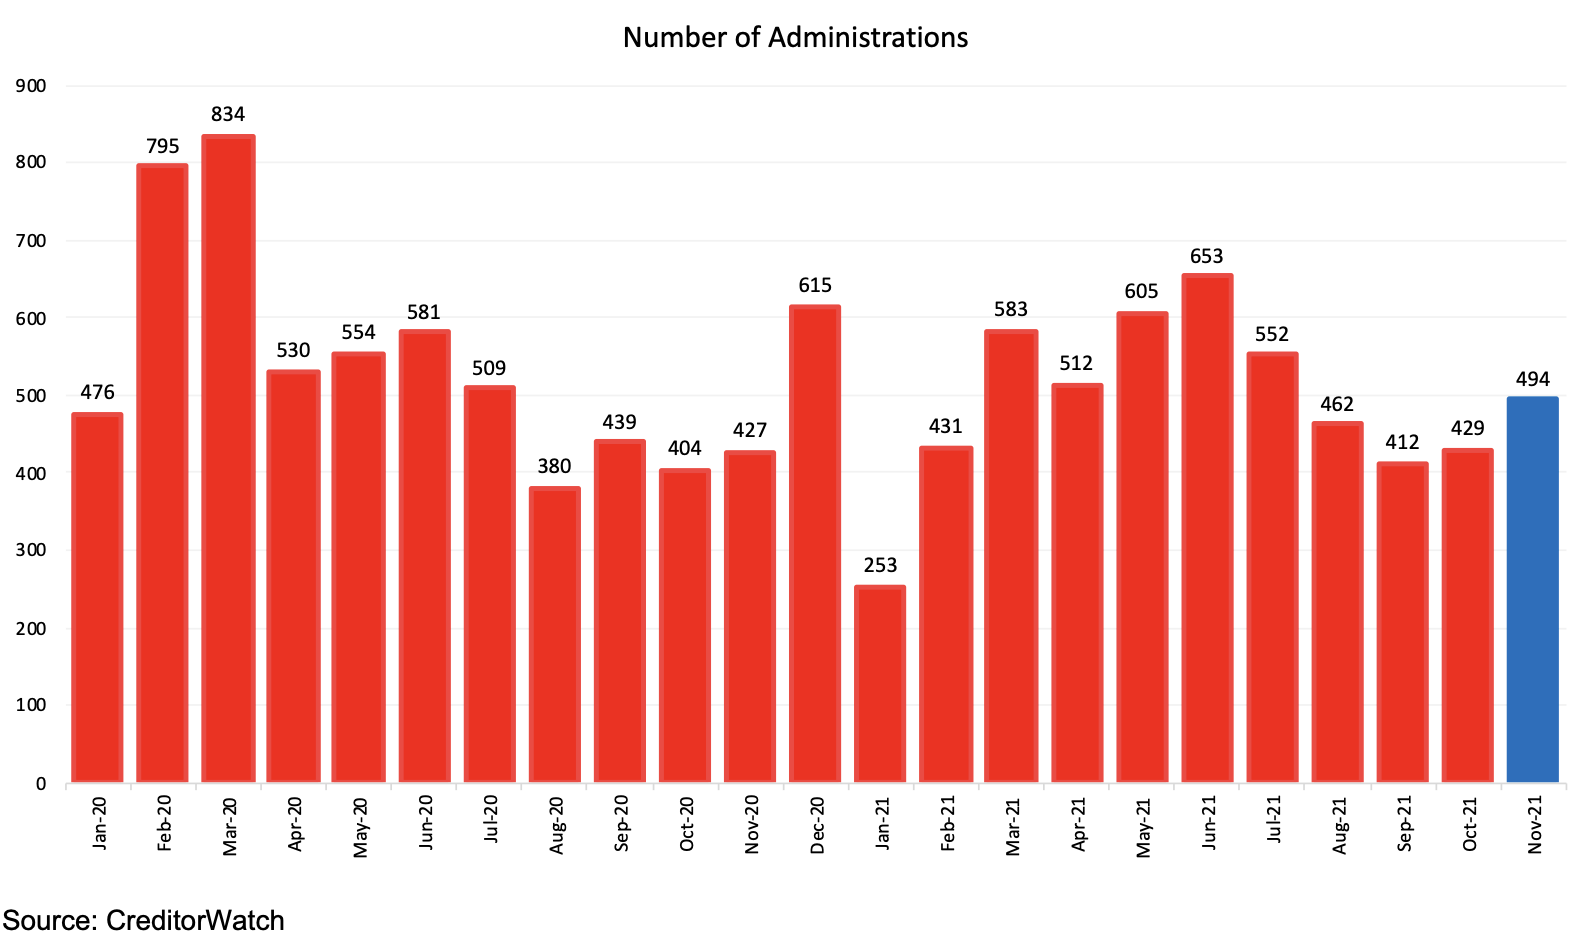
External administrations
The number of external administrations was up 15 per cent in November, the second consecutive monthly increase. This result follows consistent falls from June in the lockdown periods. We need to observe far more evidence before calling a post-lockdown return to normality, but events are moving in that direction.
Credit enquiries
The number of credit enquiries jumped by 17 per cent in November. This is the largest monthly increase since March. Over the November ‘quarter’, credit enquiries rose by seven per cent compared to the same period in 2020. We’re a long way off from cooking the roast, but a continued improvement in credit enquiries would provide a key leading indication of better business conditions and consequently overall economic activity.
Business turnover
Business turnover continued to decline from October to November. On an annual basis business turnover dropped by 42 per cent in November, the twenty second consecutive drop and the sharpest during that time. This is a sign that the recovery will be protracted and very uneven across industries and geographical jurisdictions.
Outlook
The economy is coming back from the contraction of the September 2021 quarter, but we are unlikely to see a consumer-led recovery where households begin spending the $400 billion in savings they have accumulated on a grand scale. The recovery will be patchy and will take time, although we will almost certainly avoid another contraction in Gross Domestic Product (GDP) in the December 2021 quarter. Off a positive base, the economy is expected to continue growing in 2022.
Contact
Mitchy Koper
GM Communications and Marketing, CreditorWatch
mitchy.koper@creditorwatch.com.au
0417 771 778
ABOUT THE BUSINESS RISK INDEX
The Business Risk Index is a predictive economic indicator to help guide businesses when making future growth plans and inform public policy. It is a new credit rating that ranks more than 300 Australian geographies by relative insolvency risk, providing unique insights into the health of Australian businesses by region.
Each region is ranked from best to worst in terms of the potential for businesses in it to become insolvent. The index can also measure the potential for insolvency risk at a national, state and individual business level.
Regions are ranked on a scale from zero to 100, where 100 represents the best credit quality regions, that is, the lowest risk of insolvency, and zero represents the weakest credit quality regions, that is, the highest insolvency risk.
The index is calibrated by data from approximately 1.1 million ASIC-registered, credit-active businesses. It combines these insights with CreditorWatch’s proprietary data, previously published as the monthly Business Risk Review.
Subscribe to the Business Risk Index to be the first to receive our monthly updates.