Building the model
In this four-part series, CreditorWatch Software Architect Developer, Juanjo Lainez Reche, takes you through the development of the Business Risk Index – one of the most complex and ambitious projects ever undertaken by the company.
In my first article I outlined how we built the master datasets and our online transaction processing platform (OLTP), which fuels most of the CreditorWatch’s website and platform. In the second one, we covered how we architected and built our online analytical processing platform (OLAP) and the steps we took to be able to process a vast amount of data in a quite small timeframe.
In this one, we’ll see how we built the model and the decision-making involved in the process. Because of intellectual property constraints, we won’t be specifying all the predictors we used (if we did, the article would probably be as long as a book), but we’ll specify how we determined which predictors were relevant and why they got into the model.
What is the Business Risk Index?
The Business Risk Index is an economic indicator that ranks around 300 regions in Australia from best to worst in terms of the potential for businesses in the regions to go insolvent.
This index is a forward-looking one, which means that it’s trying to, with current data, predict how likely a region is going to be performing in the next 12 months. This unique forecasting approach allows regulators and investors to get a prediction on how a region will perform and the level of risk in the next year so they can act on it.
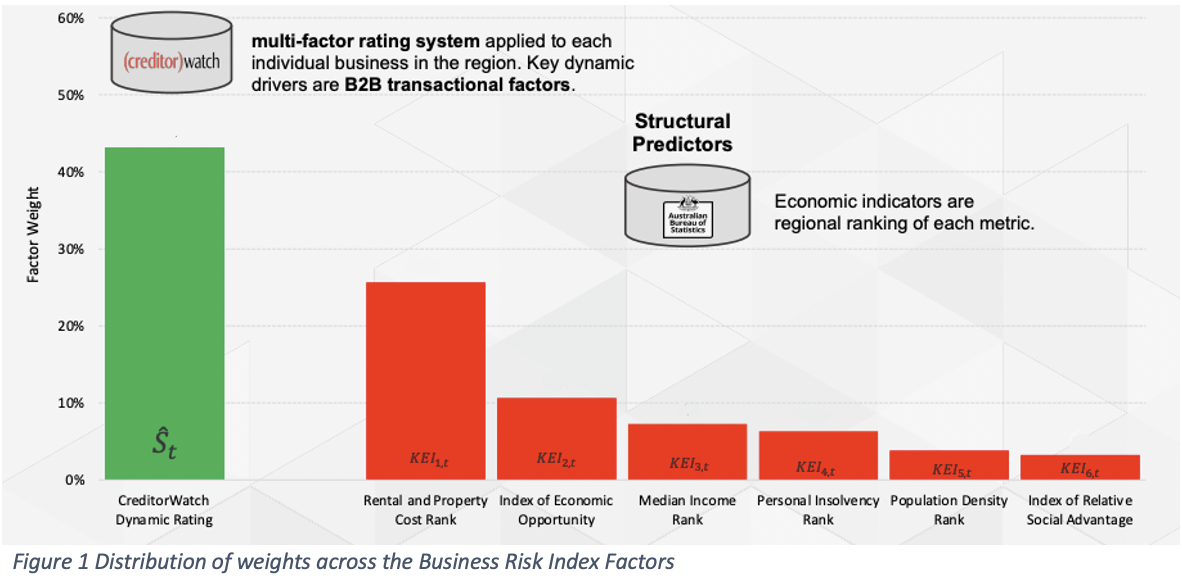
As we explained in the previous articles, this index based on the Risk Rating dataset, PaymentRating dataset and some extra structural predictors for each region provided by the Australian Bureau of Statistics (ABS). The ABS data that we use is Rental and Property Cost Rank, Index of Economic Opportunity, Median Income Rank, Personal Insolvency Rank, Population Density Rank and Index of Relative Social Advantage1.
In the image below, you can see how we weight all these factors to create the index
Creating the CreditorWatch Dynamic Rating
We’ve seen in the second part of this series how we created the code and the technologies behind the RiskRating and PaymentRating, but in this one we’ll cover a bit more how we chose the data behind it and how we built such datasets that go into the Business Risk Index.
The first thing we did was to realise that different companies have different behaviours, so it became clear to us that the RiskRating couldn’t be just a model, but a family of models2.
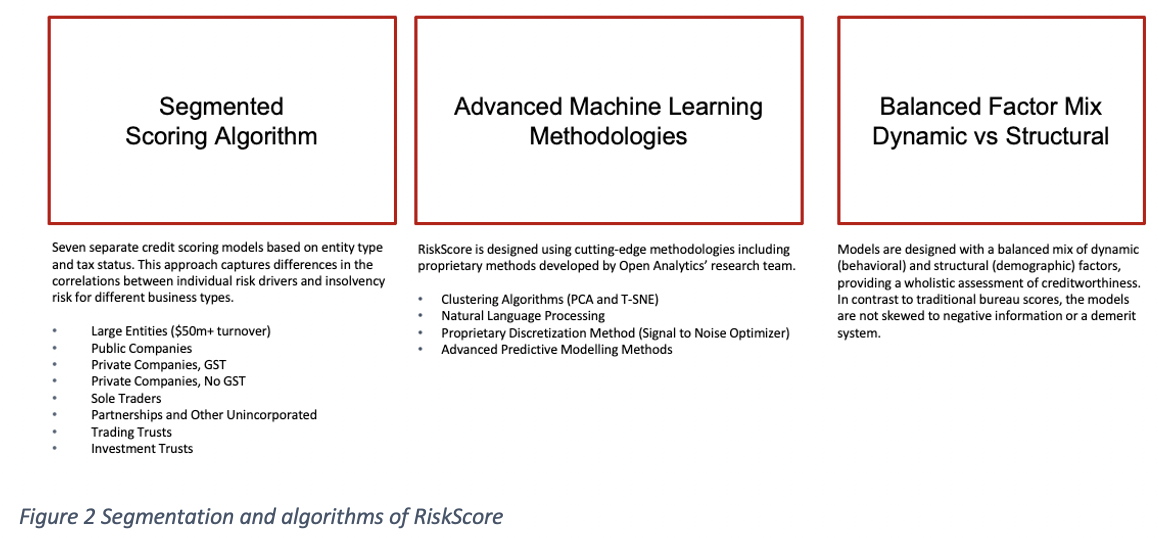
The way we decided how to separate the companies in different segments was because they have slightly different default definitions (some companies are not registered to ASIC, some are, some don’t necessarily are registered in ABR, ….) and because of the knowledge and the know-how of the experts behind the design of the algorithm. The algorithm was designed by the team at Open Analytics, who has been developing these models for Australia’s largest banks of Australia for more than a decade.
Now that we’ve identified several segments (or types of companies), we need to make sure that we choose the right predictors for the model. This first phase of the algorithm design, where we build the predictors that we’ll later use to train the RiskRatings is called feature engineering3.
In this process, we use our data knowledge to build characteristics or features that might later be used as predictors. Some examples might be the age of the business or the number of directors for a company. Now there are more than 100 predictors that we calculate for every company in a specific point of time4, but not all of them are in every model.
To quickly check if a predictor is correlated with the probability of default over the next 12 months, we try to see if their values are correlated with such probability of default. An example of such a check can be seen in the graph below:
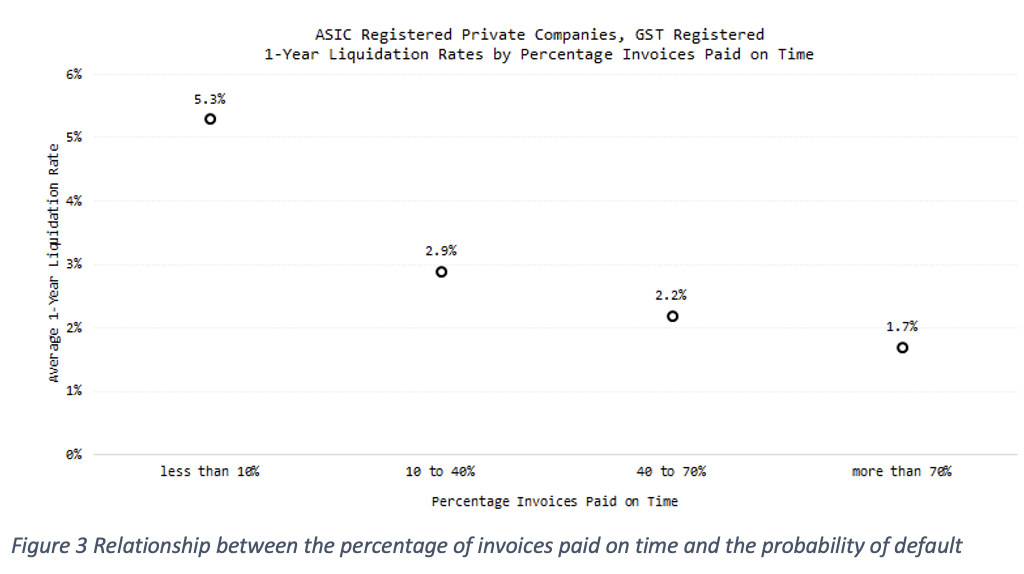
Figure 3 shows the relationship between the percentage of invoices paid on time and the probability of default. This data is exclusive to CreditorWatch and comes from accounting integrations with Xero and MYOB and ATB uploads.
Our data shows the risk assessment of when a company stops paying its invoices on time, the probability of default is four times higher than those companies that can pay 70 per cent or more of their invoices in due time. This tells us that payment times and delinquency are good potential predictors for our RiskScore model.
Something else to notice from Figure 3 is that the X axis is not continuous, but discrete. To accommodate non-linearity in continuous variables, we apply binning algorithms5 (also called bucketing, categorisation or discretisation algorithms). This allows us to easily work with categorical variables such as industry.
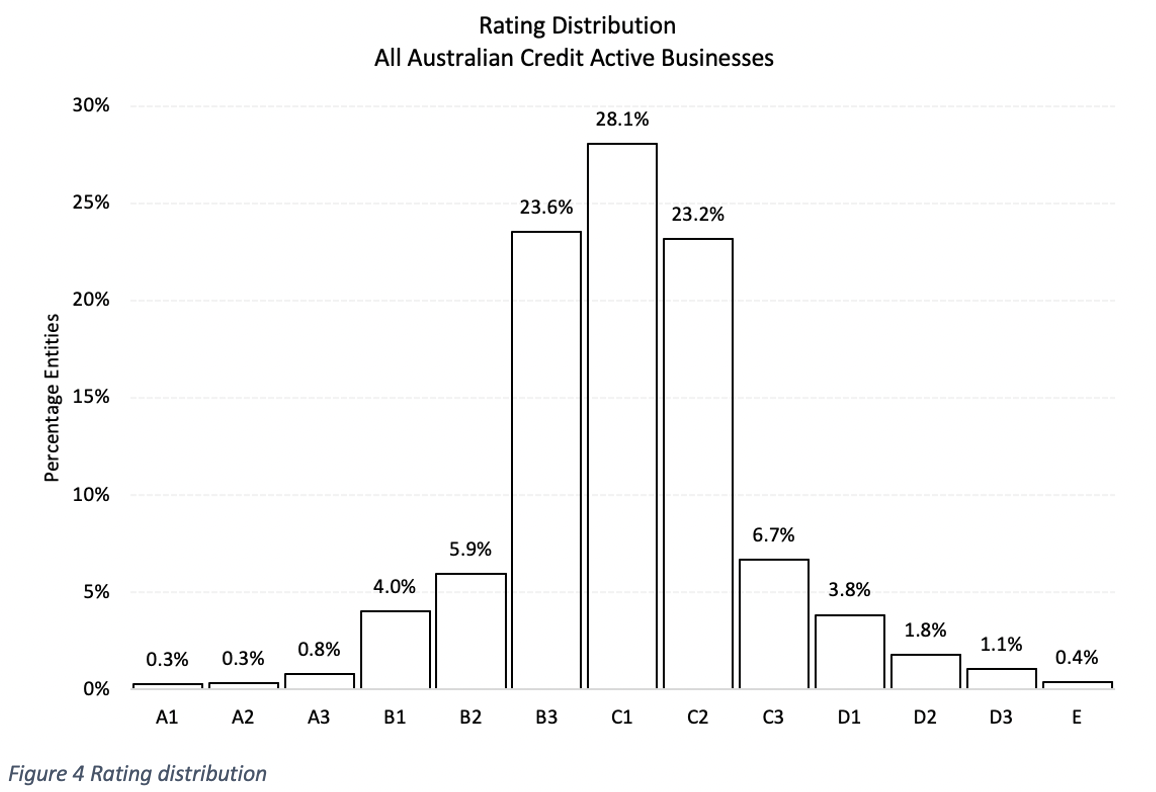
Once we have all the predictors for each of the models, it’s time to train and test them. After training, we get the following rating distribution.
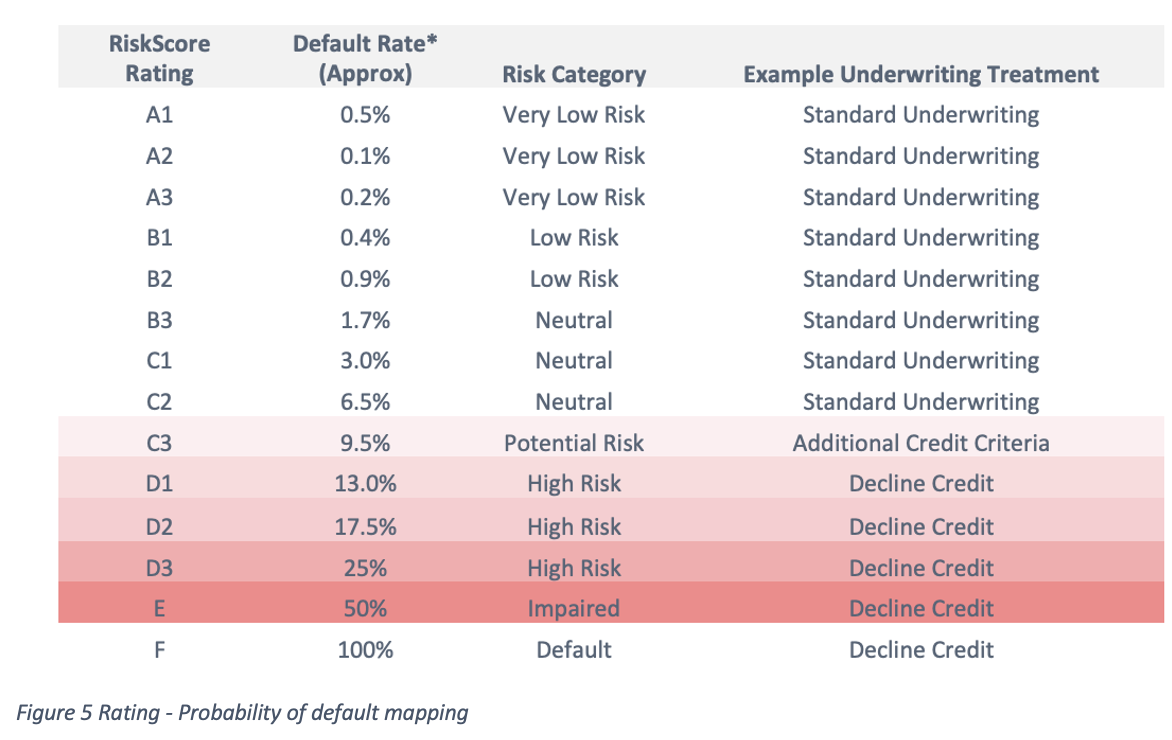
Which matches the following probability of default table:
Now that we have a model, we need to test that it works. There are some formal measures for the performance of a credit score, such as the Gini coefficient6, but for the purpose of explaining visually how it works, we’ll map the predicted probability of default against the observed probability of default for each rating. We can see that the algorithm is predictive if both predicted and observed are the same (or very similar).
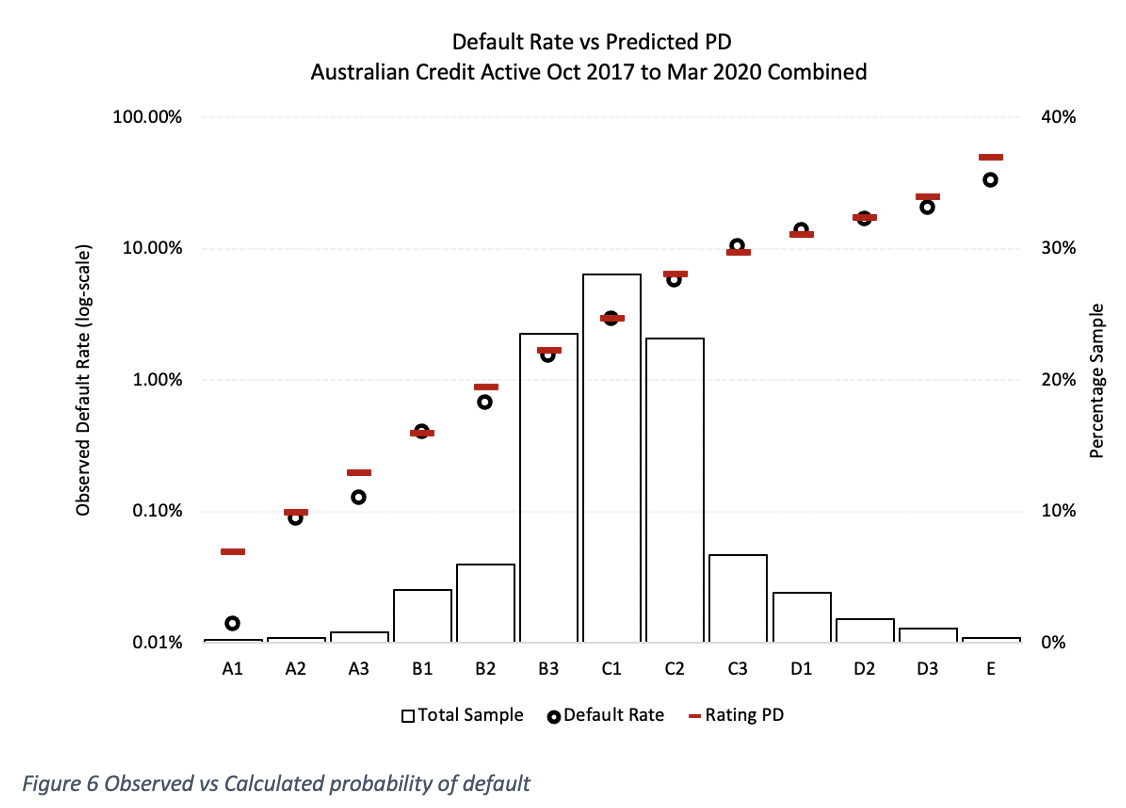 We can see that the observed probability of default (balls) and the calculated one (red dash) are very similar, which visually tells us that the algorithm that we’ve designed is, in fact, very predictive.
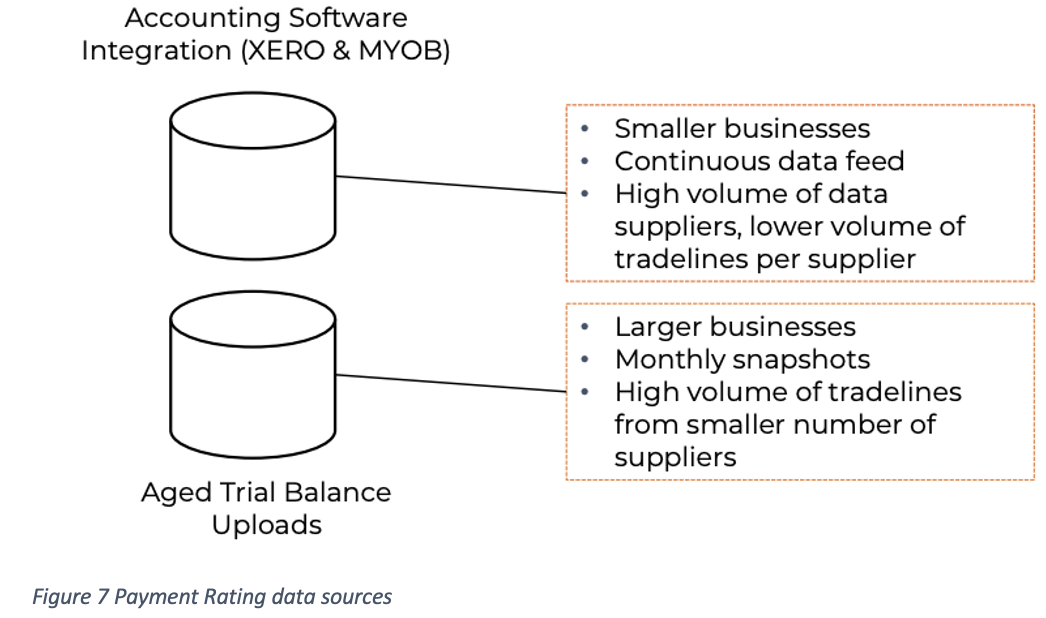
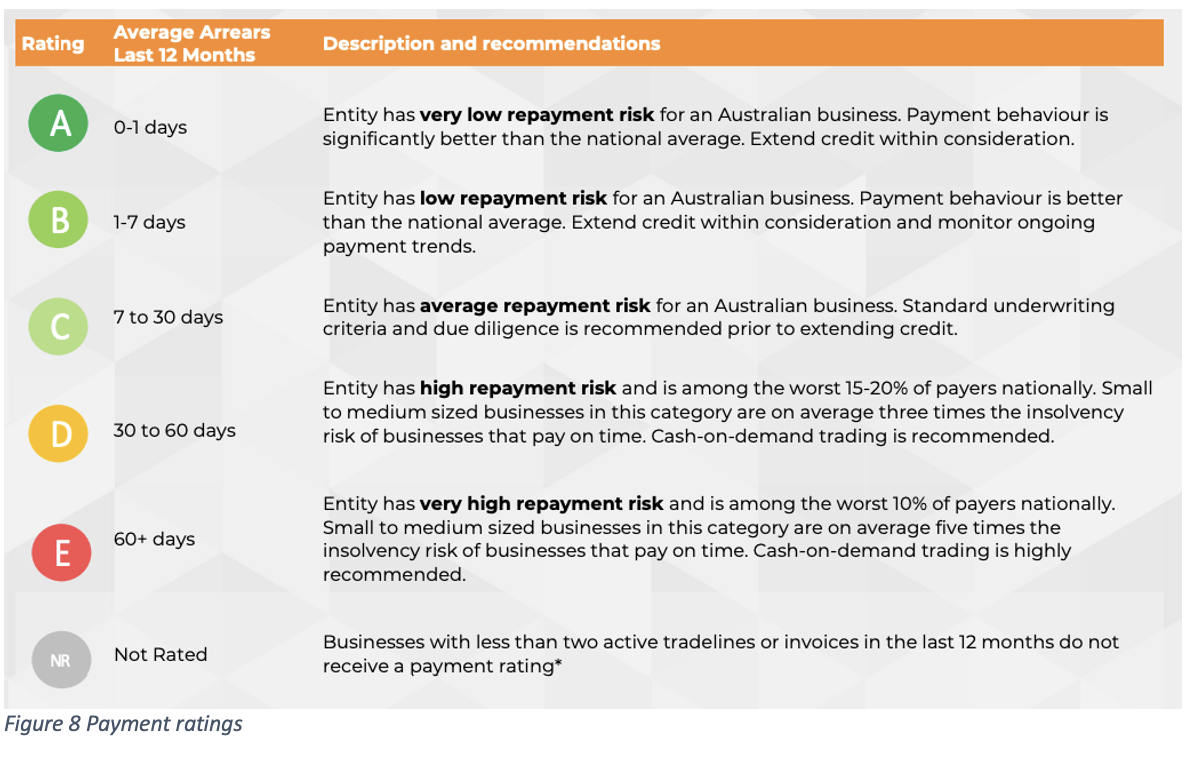
Payment rating is based on data that we gather from different accounting systems, such as Xero, MYOB and Aged Trial Balance (ATB) uploads.
Once we have the raw data, we need to filter which invoices are valid, determine how we deal with reimbursements, and how to manage many other edge cases that we’ve observed during several years of ingesting and understanding this big data.
The goal is to accurately determine how late companies are paying invoices to provide an estimate on how much time (on average) a customer of that company can expect to be paid.
We also checked how payment ratings affect the probability of defaults:
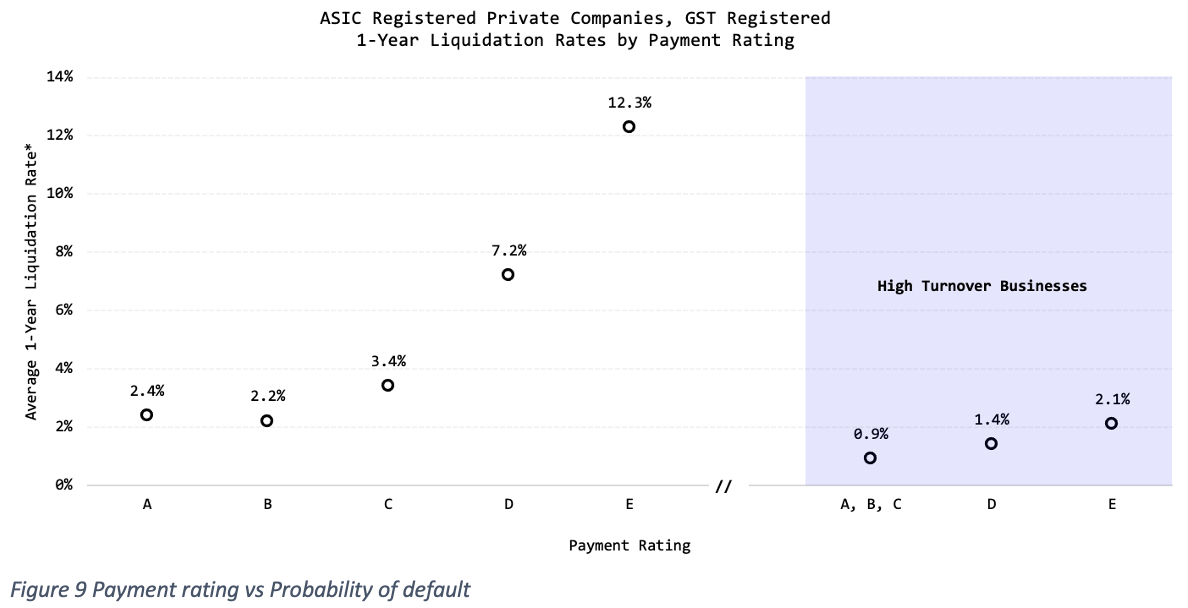
We saw that poor payment rating was a good indicator of probability of default since it signals liquidity issues for most companies except for larger businesses with high turnover. Some of those high-turnover companies that we’ve found with D-E ratings are big construction companies that, even though they are unlikely to default, have a record of paying their invoices consistently late.
Calculating the Business Risk Index
Once we have the RiskRating and the PaymentRating datasets, it’s time to group and combine them by regions.
To classify companies by regions, we’ve chosen SA3 regions8 , which are divisions of populations that range between 30,000 and 130,000 people. To make the index significant, we haven’t provided an index value for those regions that have less than 1,000 companies, since we considered that the number of companies in them was not enough to provide a meaningful metric. To calculate the Business Risk Index9, we calculate the formula:
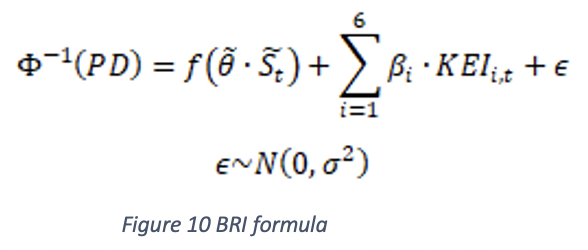
Where ‘f’ is a proprietary function that we train with more than 30 predictors from the RiskScore and PaymentRisk datasets that capture non-linear and dynamic relationships. Complimenting this mixed model there’s the second part that captures structural factors from this region with a simple linear relationship. This will produce a table such as this:
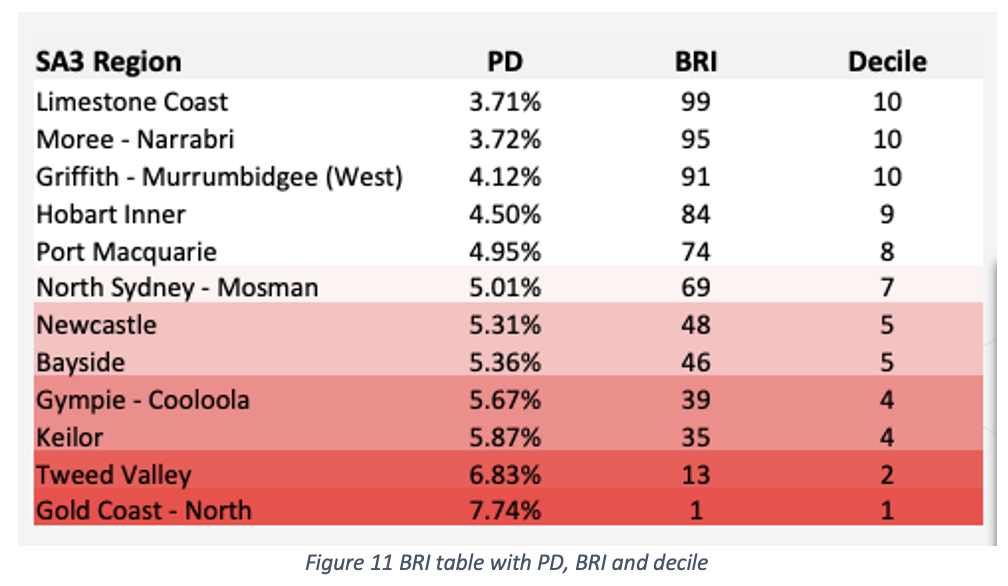
An interesting graph derived from this index is the following one, which compares the current probability of default (by SA3 region) against the predicted one.
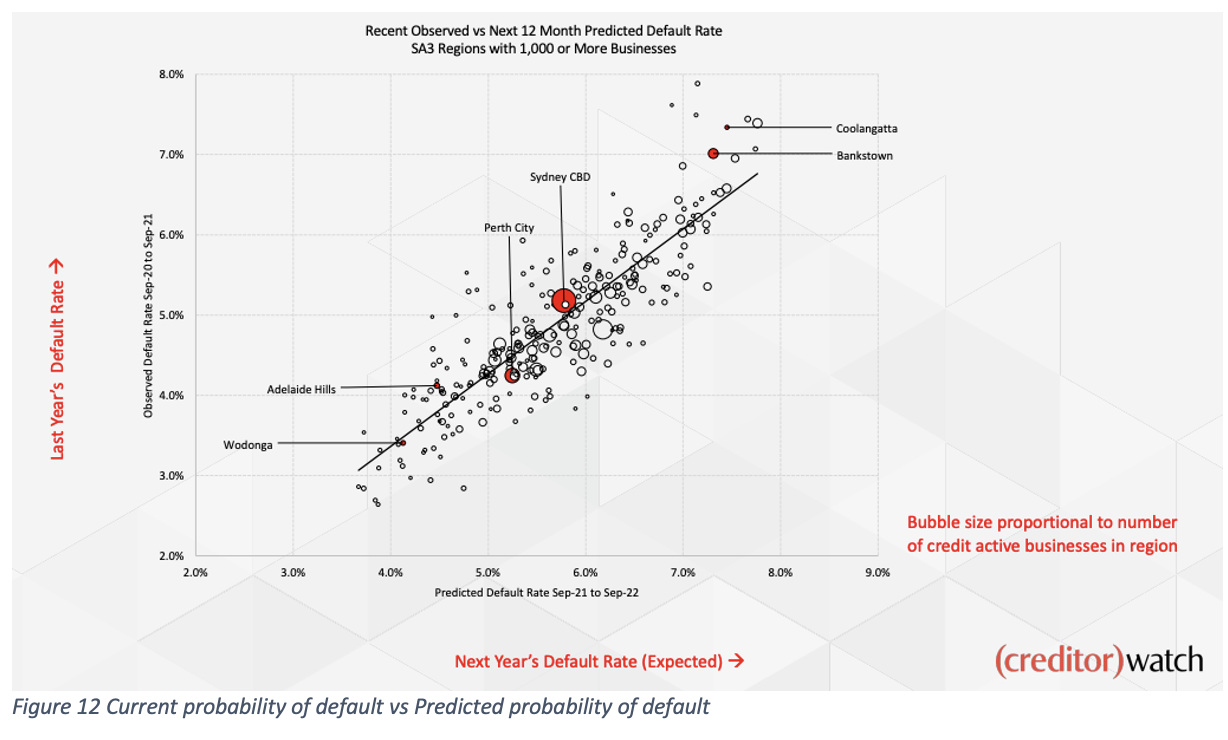
Every region would like to be positioned as far left as possible, which indicates those that have a low probability of default, and on the top of the line, which indicates that the predicted probability of default over the next 12 months is lower than the current (observed) probability of default.
That concludes the data journey for the current Business Risk Index calculation and the data that is behind it. This article is an extremely condensed data analysis version of the actual index implementation, which gathers around 400 billion datapoints, and growing, which probably provides enough content for a whole book. I hope that in this article you have been able to observe the process that we’ve followed, what datasets are involved and how are they calculated and tested.
In the next (and final) article we’ll cover how we went from having just a Business Risk Index dataset (CSV) to a nice looking website https://creditorwatch.com.au/businessriskindex/ that scales and can hold peaks of audience during every month’s release without incurring significant costs for the company.
Sources:
[3] https://en.wikipedia.org/wiki/Feature_engineering
[4] https://creditorwatch.com.au/blog/talking-tech-how-to-build-a-business-risk-index-part-2/
[5] https://en.wikipedia.org/wiki/Data_binning
[9] https://creditorwatch.com.au/businessriskindex/